
Reversal Patterns in Bitcoin’s Daily Chart: Insights for Traders
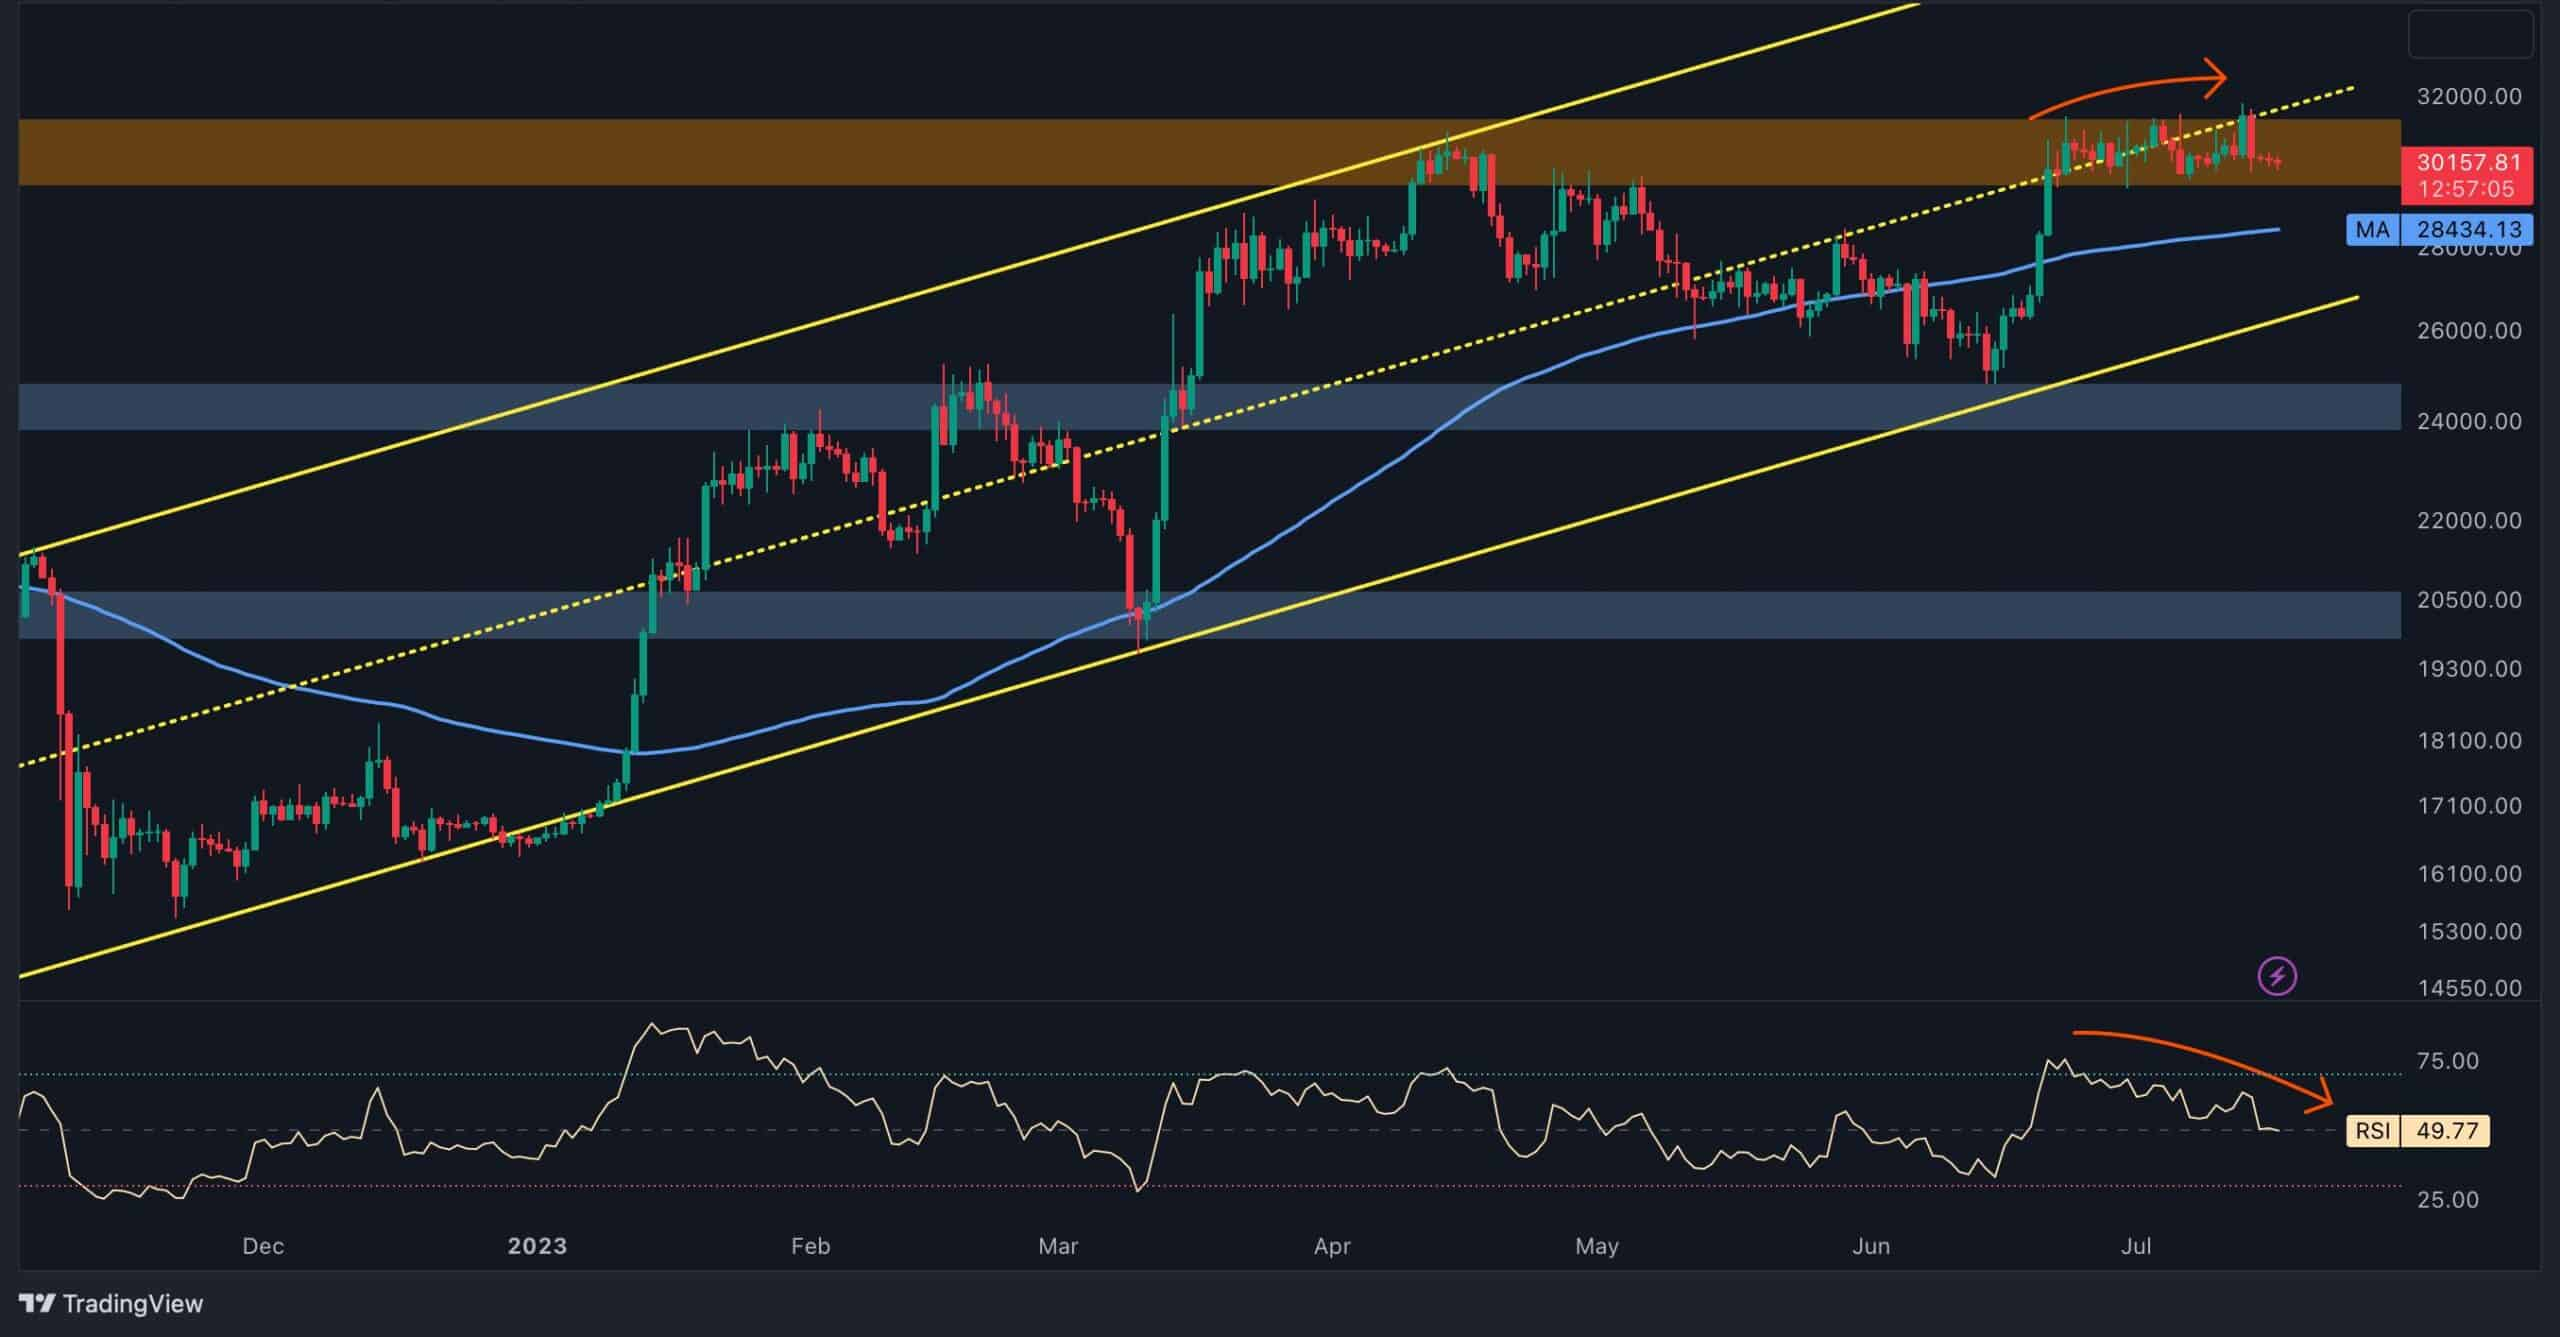
Bitcoin’s daily chart highlights the development of a bearish double-top pattern near the critical $30K resistance level, signaling potential downward momentum. Dynamic resistance from the middle trendline of the ascending channel has further restricted price growth, reinforcing the likelihood of a correction. Daily ChartThe bearish double-top pattern near $30K reflects…