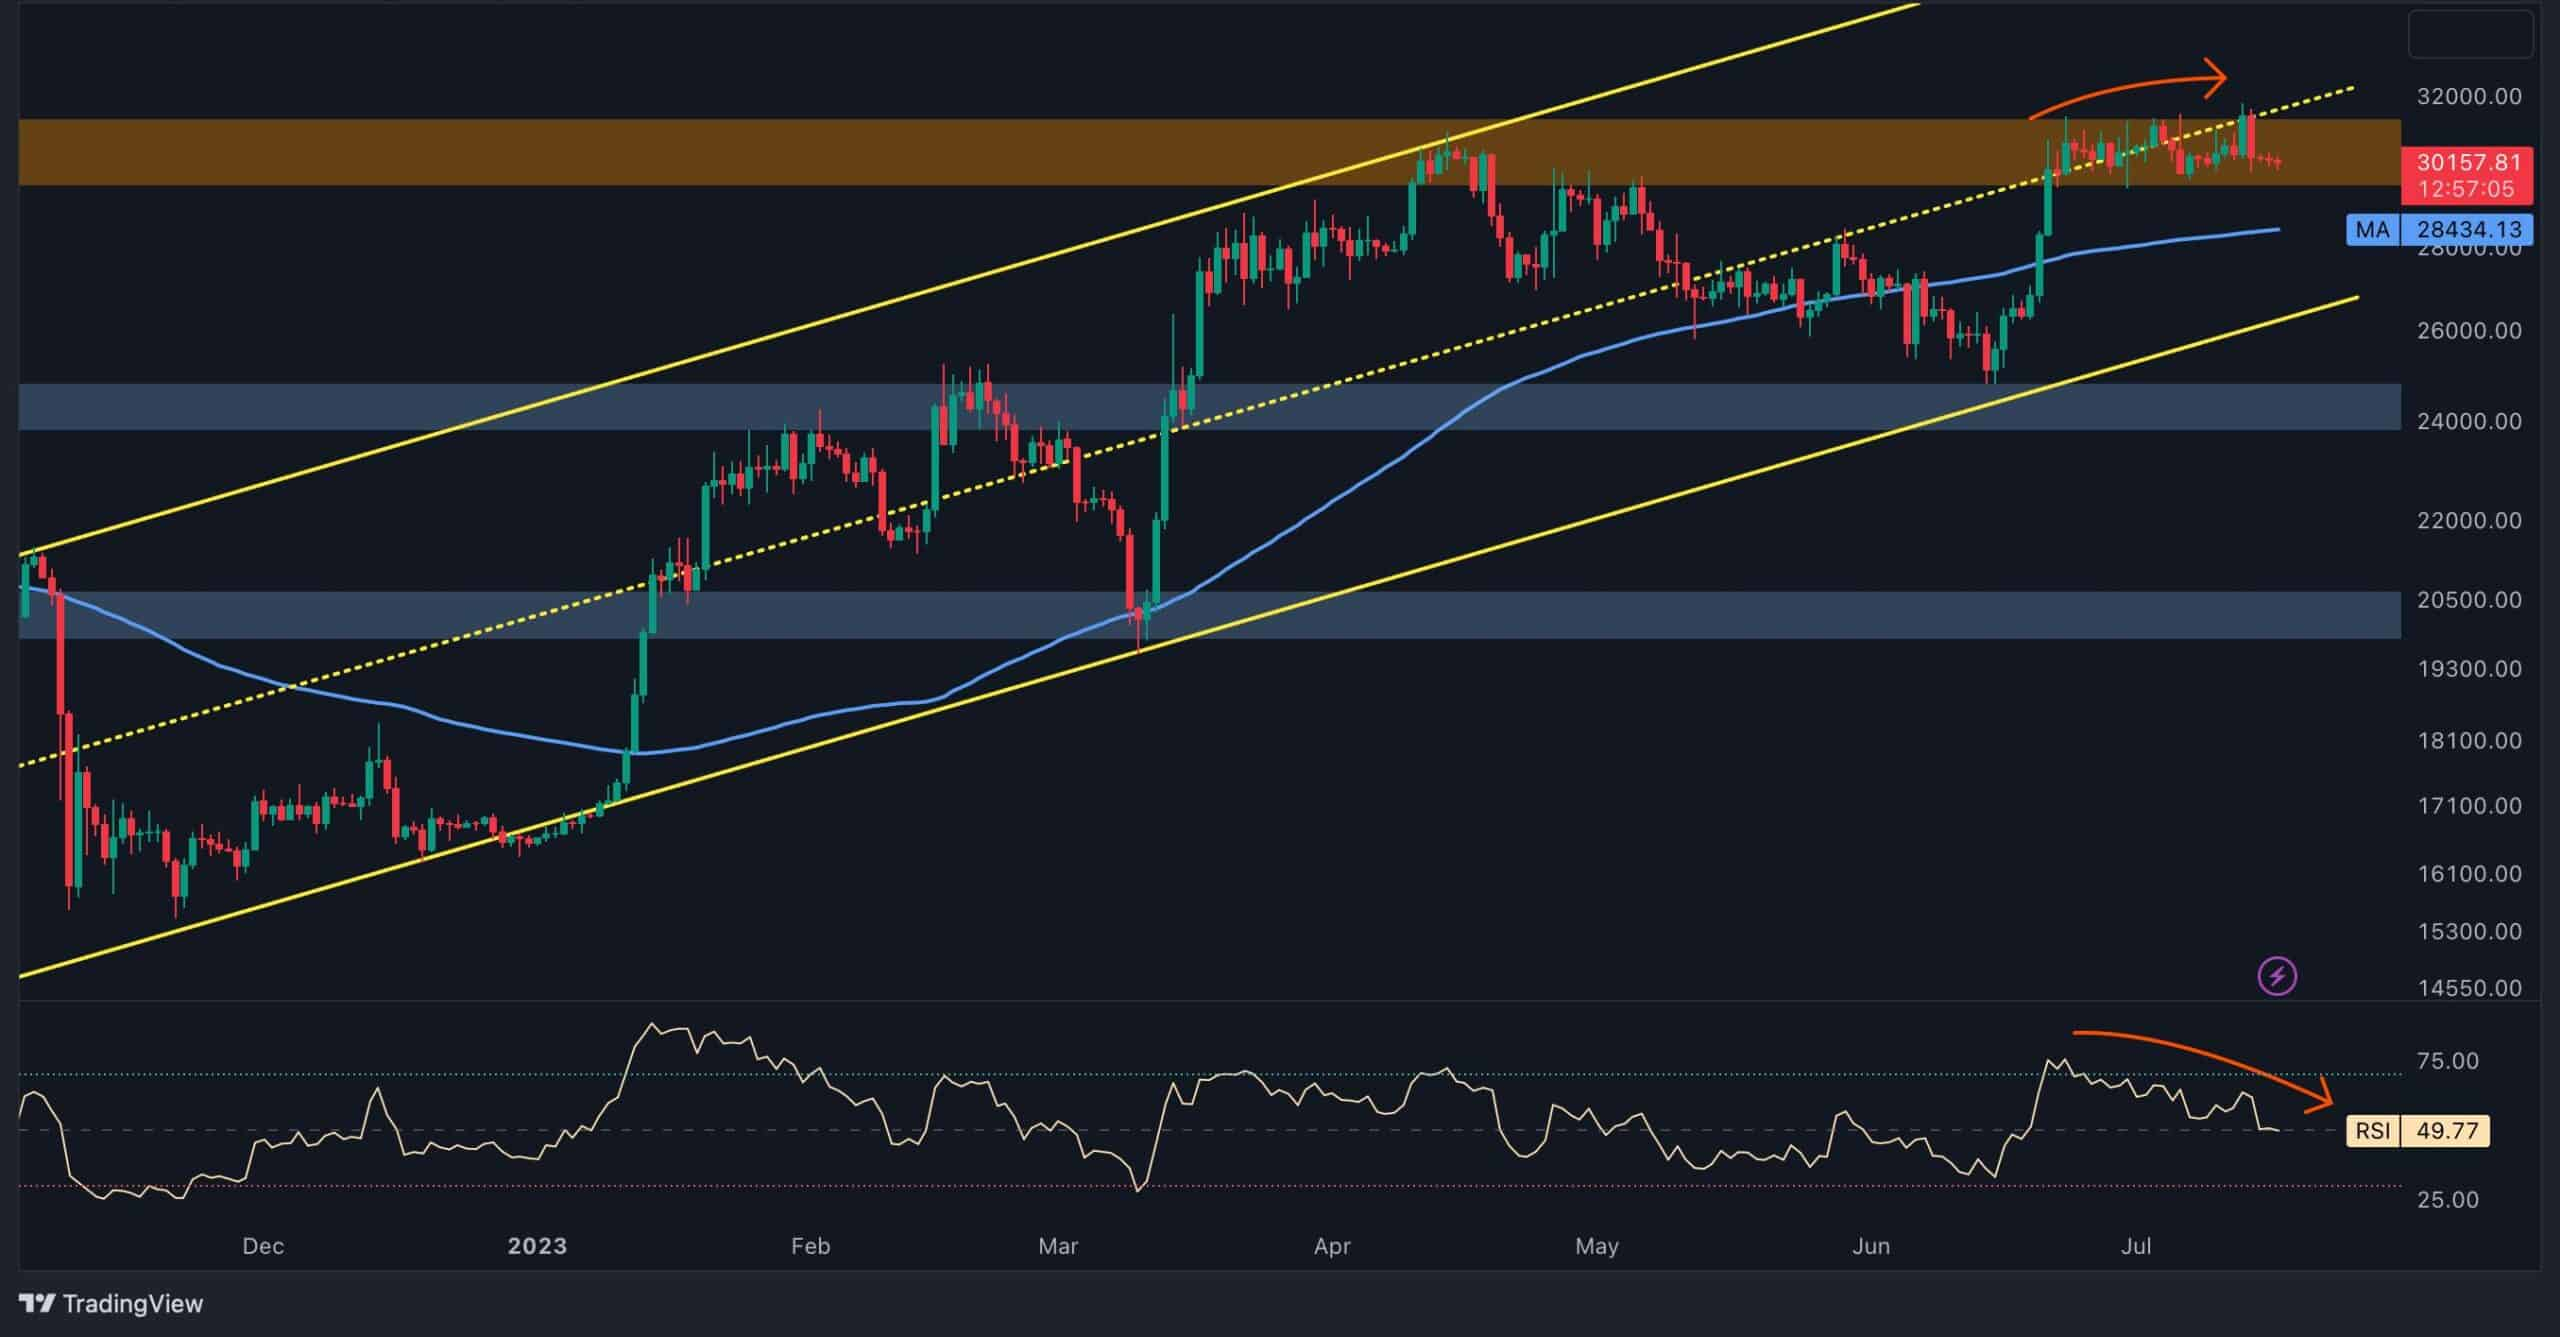
Bitcoin’s daily chart highlights the development of a bearish double-top pattern near the critical $30K resistance level, signaling potential downward momentum. Dynamic resistance from the middle trendline of the ascending channel has further restricted price growth, reinforcing the likelihood of a correction.
Daily Chart
The bearish double-top pattern near $30K reflects a strong resistance zone, amplified by divergence between Bitcoin’s price and the RSI indicator. This divergence suggests a shift from an uptrend to a possible downtrend. If selling pressure intensifies, Bitcoin may target the 100-day moving average around $28K.
A rejection at $30K appears likely given the recent price behavior, which aligns with the trendline resistance that has capped gains for months.
4-Hour Chart
The 4-hour timeframe shows Bitcoin consolidating near $30K within an ascending wedge pattern – a potential reversal signal. After testing the wedge’s upper boundary, the price experienced a sharp rejection, followed by a decline.
A breakdown below the wedge’s lower edge would confirm a bearish reversal, with the $28K static support zone emerging as the next key level. This region coincides with a prior significant swing high, enhancing its importance as a support level.
On-Chain Analysis
Market Sentiment from the Futures Market
The taker buy-sell ratio has consistently remained below 1 after a sharp decline, reflecting bearish sentiment among futures traders. This pessimism could contribute to increased downward pressure on Bitcoin’s price in the near term.