Despite a period of relative stability in the market, Bitcoin’s price action remains underwhelming with no clear signs of a strong recovery. While U.S. stock markets closed on a positive note and the DXY index has been declining for the last few days, Bitcoin has failed to maintain its position above the crucial $30K mark. Fear and uncertainty continue to dominate the market sentiment.
Technical Analysis
The Daily Chart
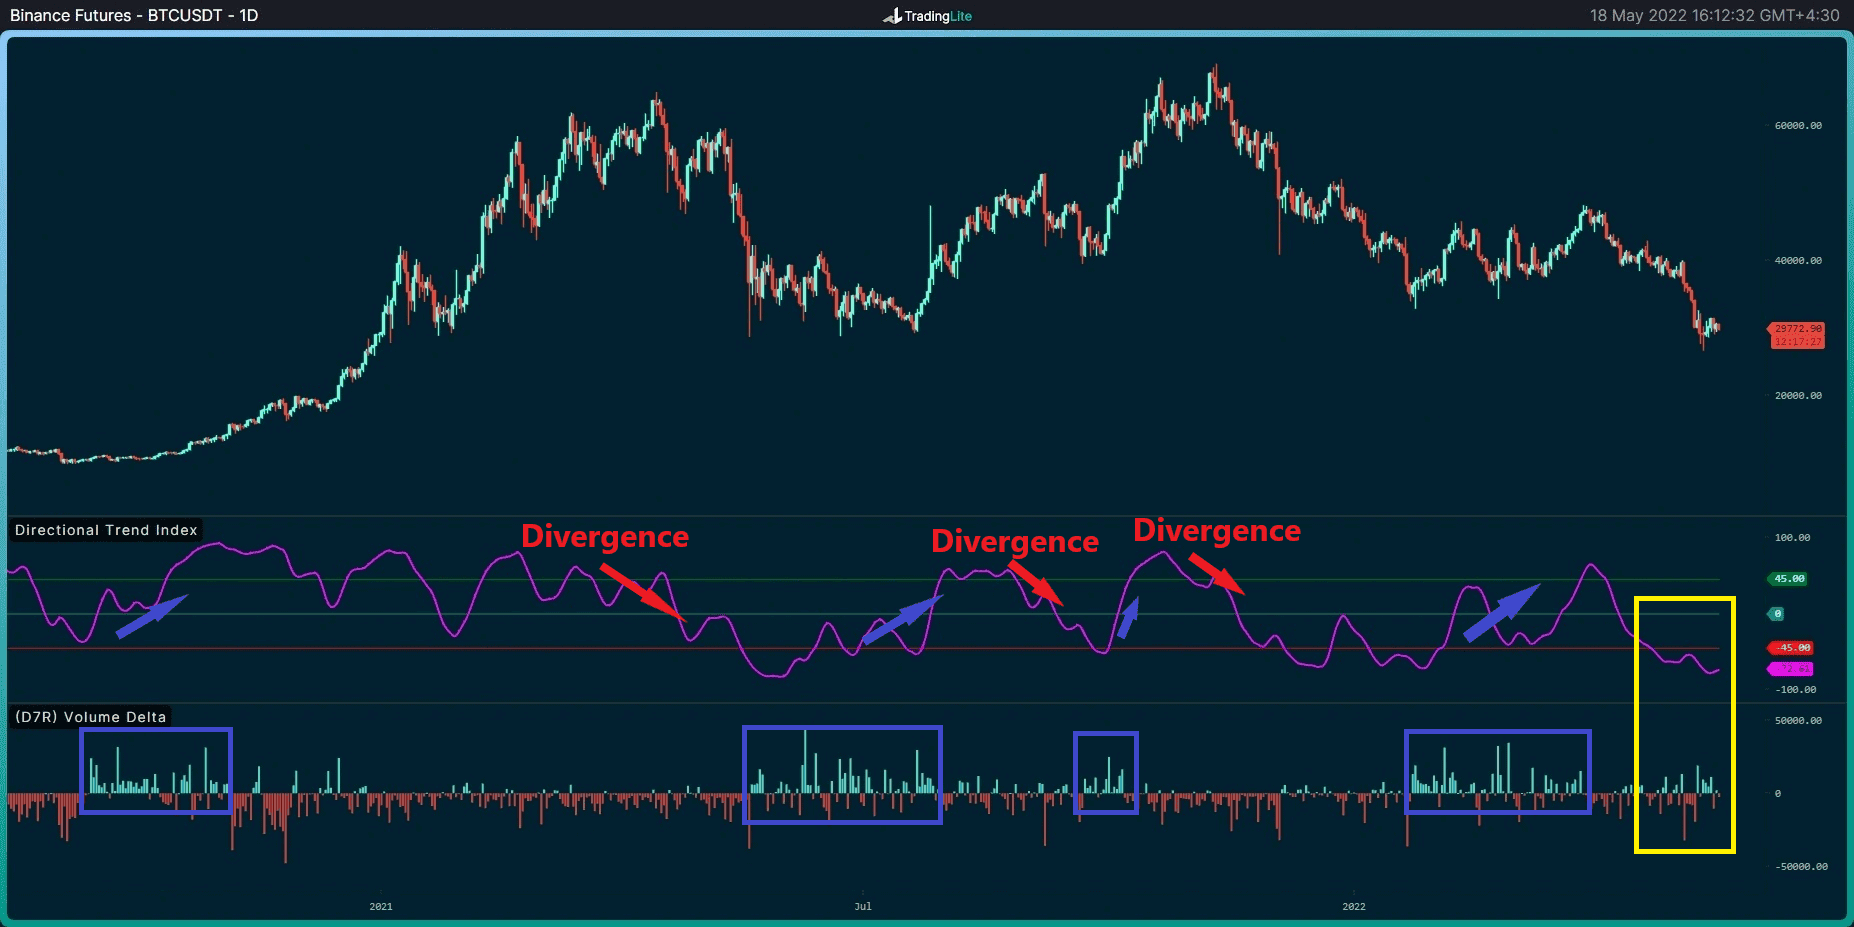
Looking at the daily chart, which displays Binance Futures price and order-book information, it’s evident that historical trends indicate a clear relationship between upward price movements and an increase in Volume Delta. This shows that buy-side pressure from takers increases when prices rise. Conversely, during downturns, we typically observe a divergence in the Directional Trend Index, suggesting that sell-side pressure dominates.
In recent days, selling pressure has been gradually reducing. A small increase in buying activity has also been noticed, which is reflected in the green histogram bars of the volume delta. However, the Directional Trend Index is still positioned below the red line, signaling that the overall trend lacks strength and continues to be weak.
If the buying pressure accelerates and the Directional Trend Index crosses above the red line, aligning with the blue line, this will confirm a trend reversal. On the other hand, if this doesn’t happen, Bitcoin is likely to remain within its bearish trend, as no signs of a reversal have yet materialized.
Key Support Levels: $28,700 & $25,400
Key Resistance Levels: $31,700 & $32,900
Moving Averages:
MA20: $33,611
MA50: $38,620
MA100: $39,986
MA200: $44,835
The 4-Hour Chart
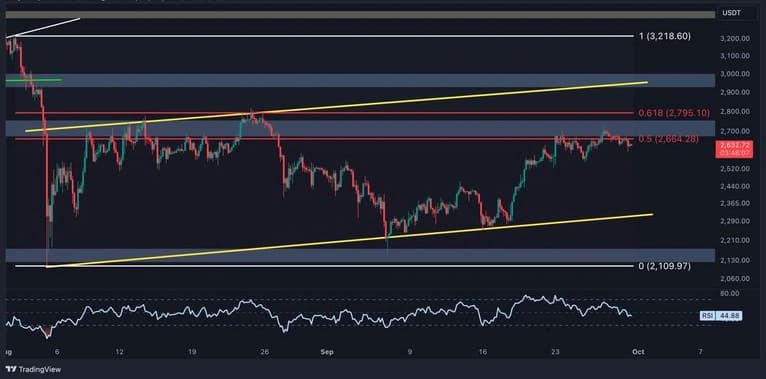
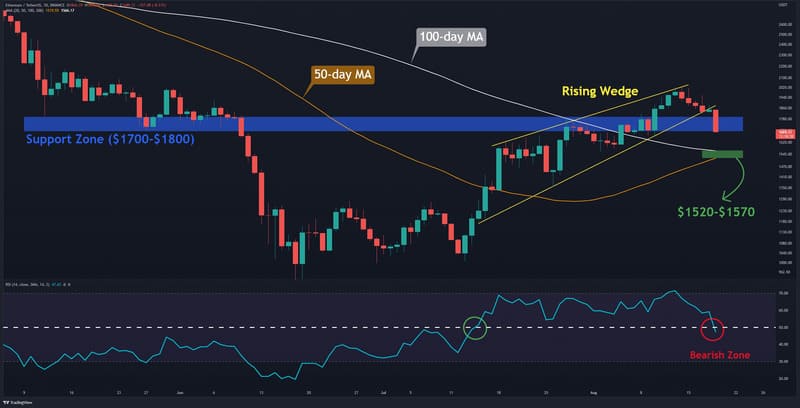
On the 4-hour chart, the bullish structure shows weakness in its recent wave. If the price manages to maintain the previous higher low at $29K and break through the red resistance zone, this could trigger a short-term uptrend. However, failure to do so may result in a retest of lower levels.
Currently, Bitcoin faces resistance at the 4-hour MA50 around $29K. The RSI is trending upwards within the bearish zone, approaching the baseline, which further emphasizes the absence of strong bullish momentum in the market.
On-Chain Analysis
Exchange Netflows
Definition: Netflows represent the difference between coins flowing into and out of exchanges. A positive netflow indicates that more coins are entering the exchange, which can be a sign of increasing selling pressure.
For spot exchanges, high netflows are generally associated with growing selling pressure. For derivative exchanges, significant netflows can often indicate heightened volatility.
Over the last couple of days, Bitcoin inflows into Coinbase have surpassed outflows. This situation mirrors what happened on May 14, when a massive withdrawal of 29,493 BTC from Coinbase contributed to a brief upward price movement. Given this recent inflow trend, it’s essential to monitor the situation closely and adjust risk strategies accordingly if inflows into Coinbase continue to increase.


