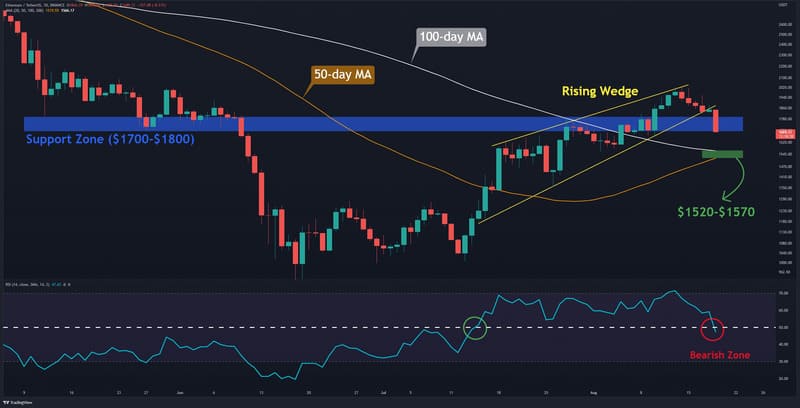
Over the past six days, Ethereum has experienced a 16% decline, following a rejection from the $2,000 level. The price has now formed a rising wedge pattern, which could signal that the bearish trend is likely to continue. The bulls must prevent a further decline below the critical support range of $1,700-$1,800 to maintain any bullish momentum.
The Relative Strength Index (RSI) indicator has also dipped below the baseline, reinforcing the idea that bearish momentum is currently dominating the market. If the price continues to drop, the next support levels are found in the range of $1,520-$1,570, which aligns with the intersection of the 50-day moving average and the 100-day moving average. A breakdown below these levels would strengthen the bearish outlook, pushing Ethereum to potentially test the $1,280 level.
Daily Moving Averages:
MA20: $1,777
MA50: $1,519
MA100: $1,566
MA200: $2,237
The ETH/BTC Chart: Bearish Sentiment Against Bitcoin
Against Bitcoin, the situation presents a slightly different picture. Although the bulls failed to break above the resistance at 0.082 BTC they still maintain control of the market. A break and close below the support zone at 0.073-0.075 BTC would signal a bearish rally, with a potential target of 0.065 BTC.
Sentiment Analysis: Bearish Sentiment Dominates
The Taker Buy/Sell Ratio (SMA14) metric shows that more sell orders have been filled by takers in the derivative market, indicating that the bearish sentiment is prevailing. As mentioned in our previous analysis, many investors have booked profits at key technical resistance levels, further contributing to the dominance of bearish sentiment. Until the metric returns above 1, the chances of a significant recovery remain limited.