On the daily chart, Ethereum has struggled to surpass the $1800 resistance zone. The price recently hit the upper boundary of a significant symmetrical triangle pattern, but bearish rejection has led to a breakdown of the 50-day moving average, which is currently positioned near $1600.
The 200-day moving average, located around $1400, now appears to be the next major support level, followed by $1300 if the pullback deepens.
Ethereum’s 4-Hour Chart: Navigating Key Support Zones
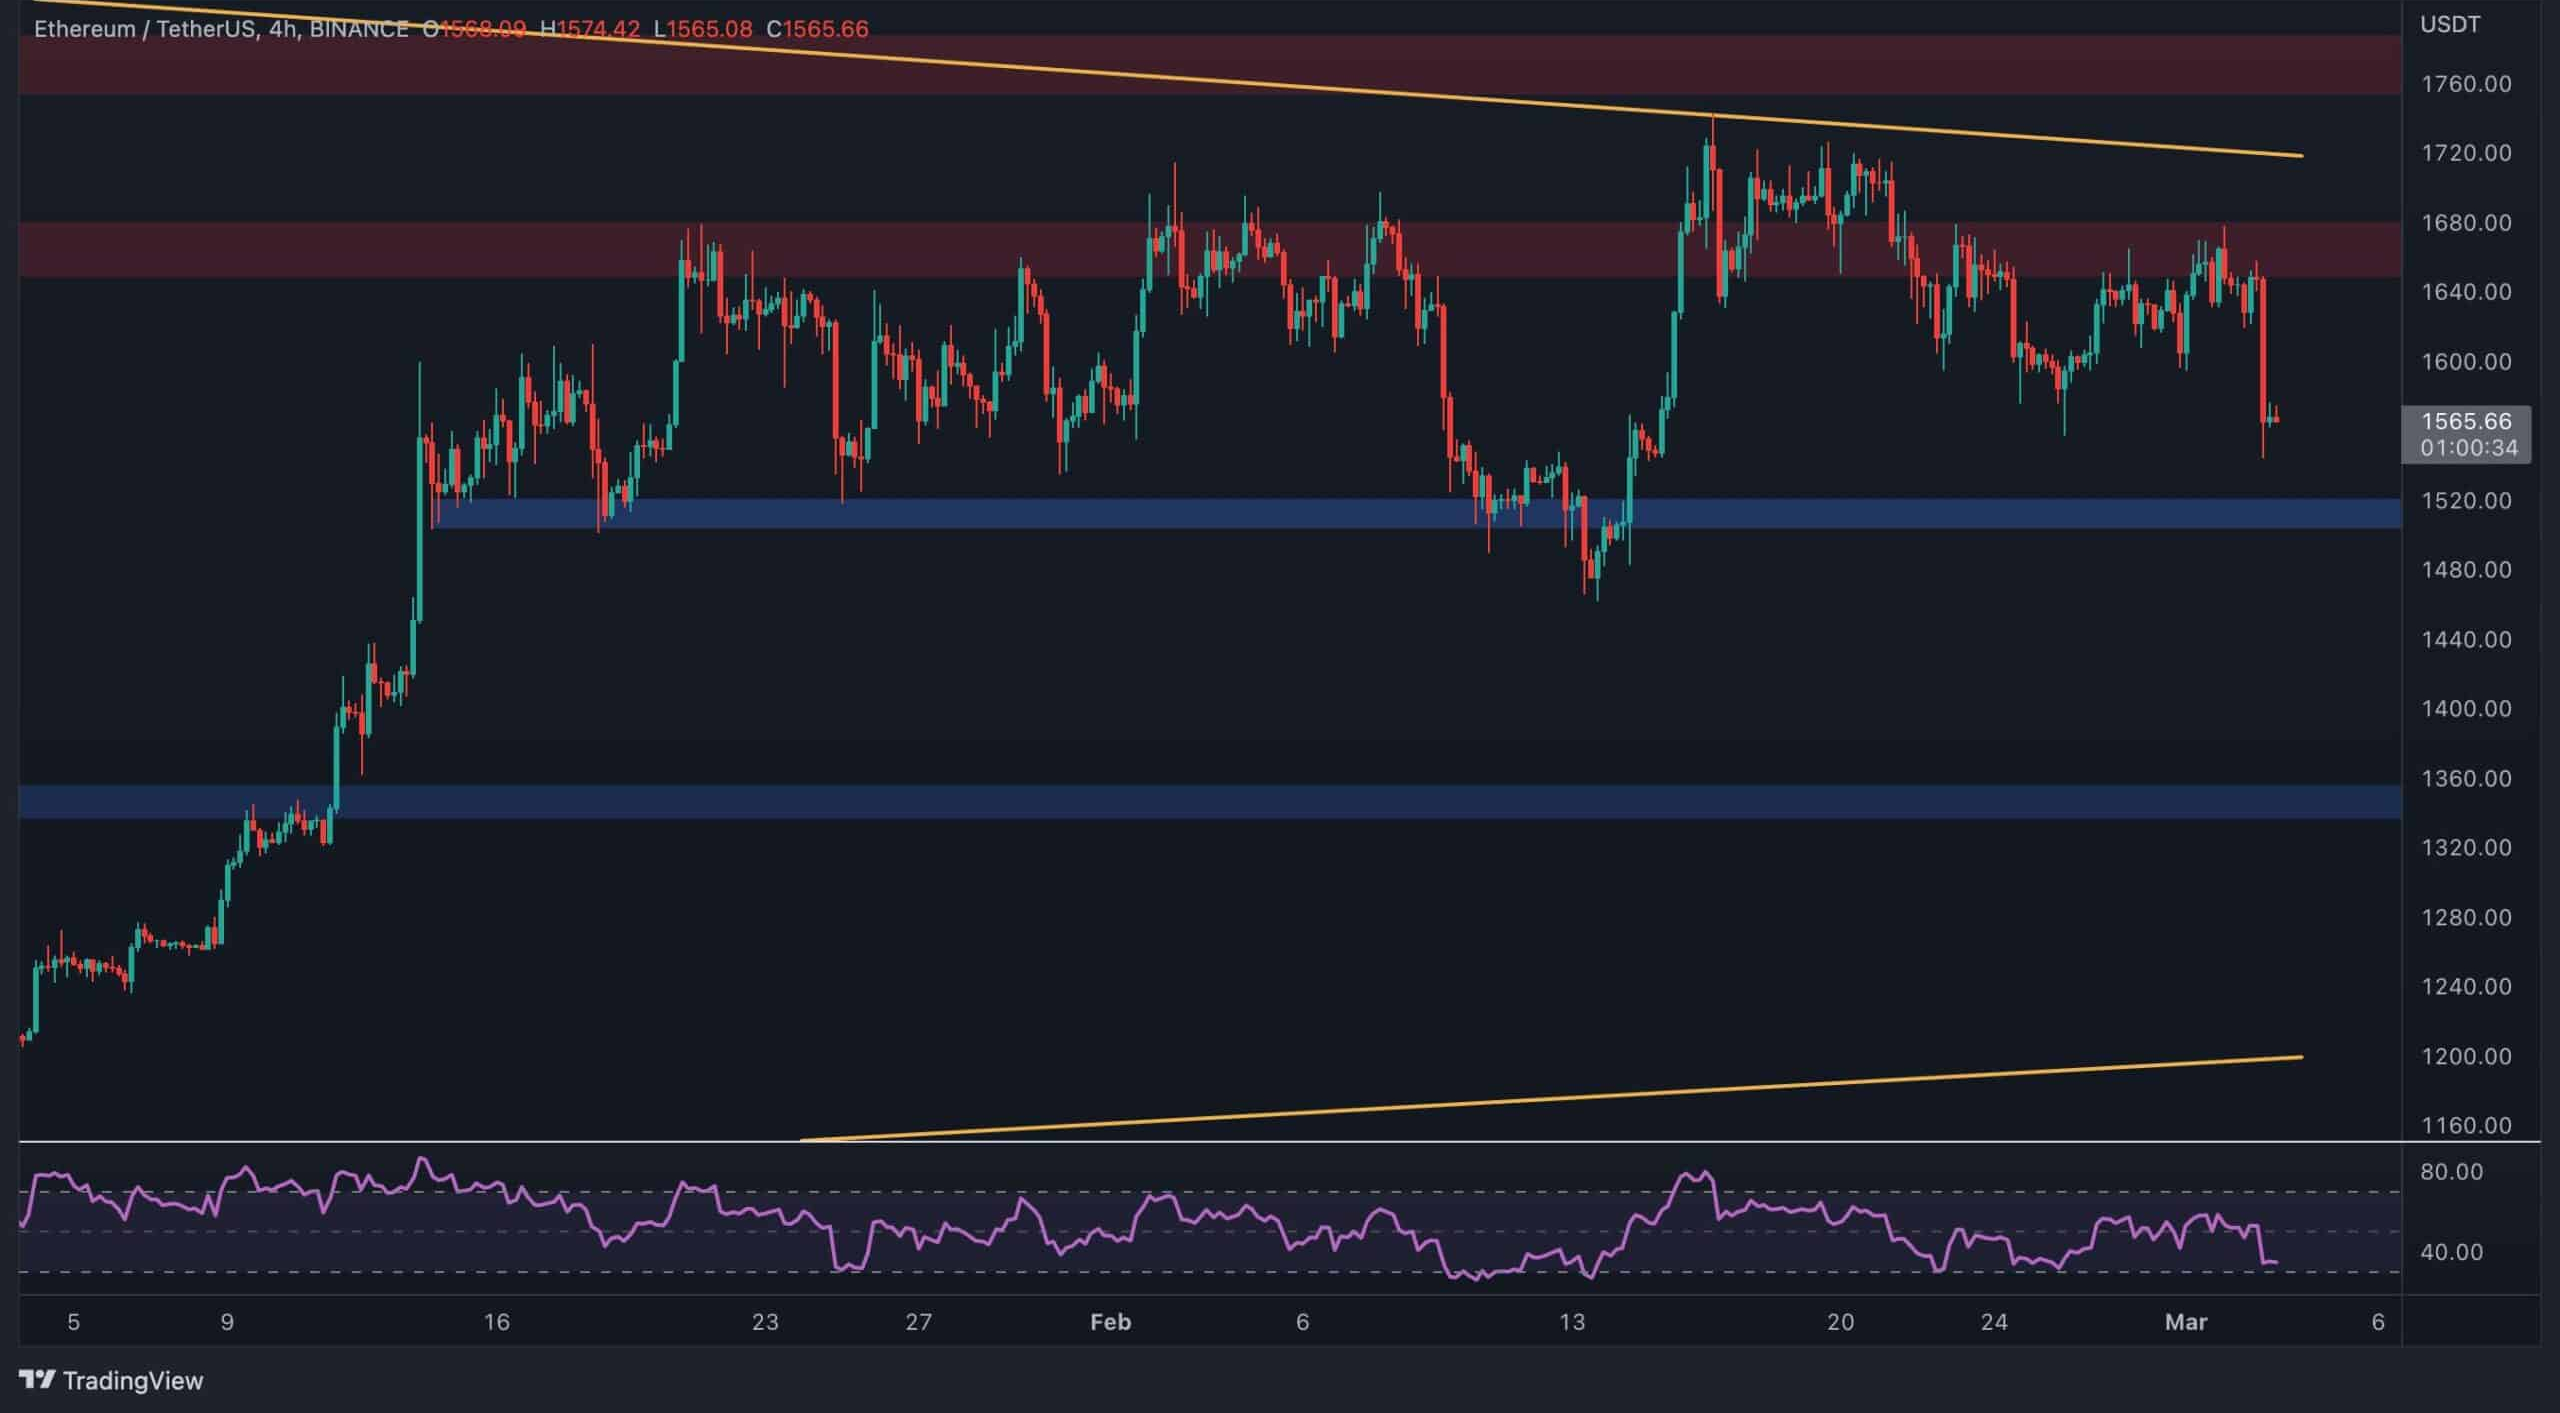
Looking at the 4-hour chart, Ethereum faced a sharp rejection at the $1650 resistance and is now poised to test the $1500 support zone. Should this support hold, the price may attempt another move toward the $1650 level and the upper boundary of the symmetrical triangle.
However, a breakdown below $1500 could lead to a further drop toward $1350, as no significant support exists between these two levels. The RSI is currently below 50%, indicating that the bears have control of the market.
That said, the RSI is approaching the oversold region, which could signal a potential consolidation phase or a short-term bullish pullback.
On-Chain Analysis: Leverage Ratio Indicates Risk in Futures Market
The Estimated Leverage Ratio provides insight into the average leverage being used in the futures market. A rising ratio often indicates that more market participants are taking on higher leverage positions. In the past few weeks, the Estimated Leverage Ratio has slightly increased, suggesting that the futures market might be becoming overheated as a result of the recent bullish price action. Though the ratio hasn’t reached worrying levels yet, a continued increase could raise concerns about a short squeeze or a long squeeze, leading to a sharp and impulsive price movement in Ethereum. It will be important to monitor this metric closely over the coming weeks to avoid potential risks and losses.


