Bitcoin has managed to dodge all three unfilled CME gaps this week, successfully pushing past the $13,235 mark for the first time since July 10, 2019, marking a 469-day high. This remarkable 11% surge was sparked by PayPal’s announcement that it would soon enable Bitcoin and other cryptocurrencies for payments. The news generated a significant wave of excitement, resulting in a $70.8 million short squeeze on BitMEX, as $31 billion flooded back into the crypto market during the frenzy.
The buying pressure from short traders scrambling to cover their positions played a key role in driving Bitcoin past critical price levels of $12,000 and $13,000. With these levels now breached, Bitcoin is entering new territory, suggesting further bullish potential.
Key Price Levels to Watch in the Short Term
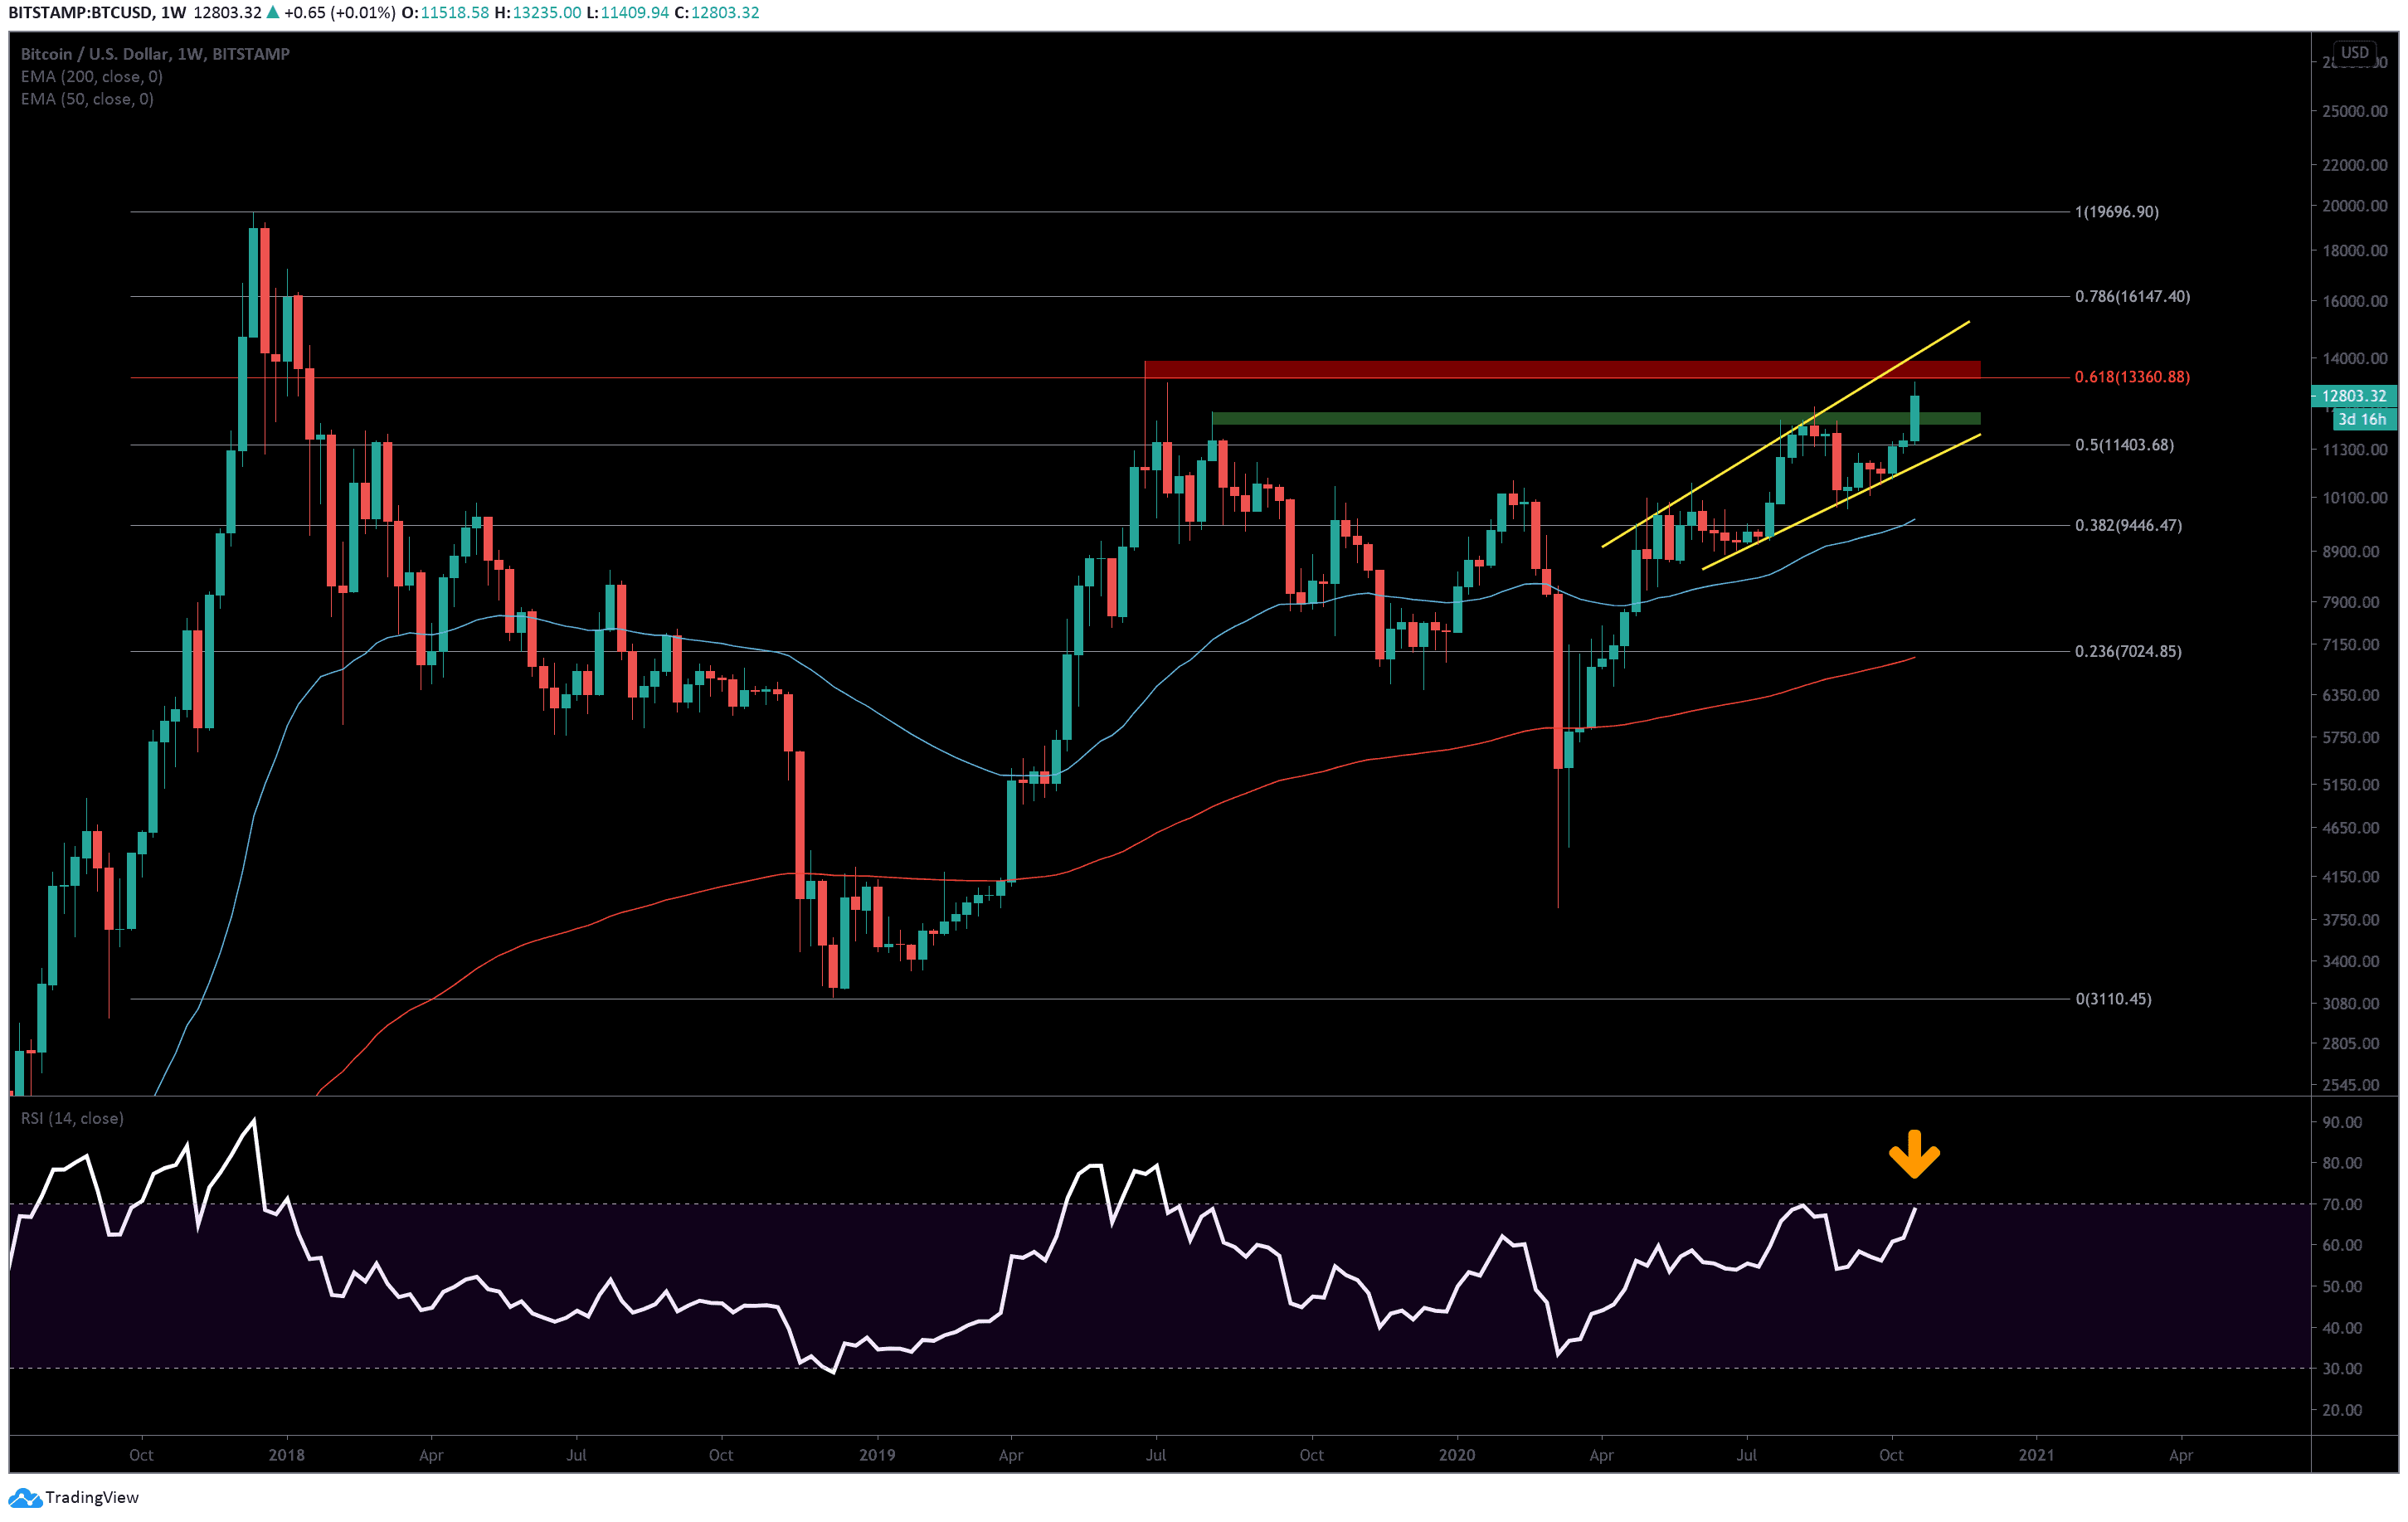
On the weekly BTC/USD chart, Bitcoin approached the 0.618 Fibonacci resistance at $13,360. Between this price point and the $13,890 level above, a major resistance zone is formed, which has not been breached since January 15, 2018. This level is particularly significant, as it was during this time that Bitcoin experienced a sharp decline following its all-time high of $20,000, making it a psychological barrier for bullish traders.
If Bitcoin breaks through this resistance zone, the next significant target lies at the upper boundary of a broadening wedge pattern, which has been developing since April 27, 2020. This trend line, located around the $14,000 level, could serve as a point of reaction. Following this, additional resistances appear at $14,600, $15,400, and $15,800, before reaching the 0.786 Fibonacci level at $16,150.
On the downside, key support levels include a critical S/R zone between $11,950 and $12,300, which could offer buying pressure in case of a bearish retracement. Should these levels fail to hold, the 0.5 Fibonacci level at $11,400, the daily 50 EMA around $11,170, and the lower support line of the broadening wedge pattern near $10,900 would be crucial levels to monitor.
Market Outlook
Bitcoin is nearing the overbought zone on the weekly RSI for the first time since July 2019, which could indicate a potential correction before the uptrend continues. As the market reacts to the RSI, a sharp decline could follow, but this could present a buying opportunity ahead of another leg higher in the ongoing bull trend.
Market Metrics
- Total Market Capitalization: $395 billion
- Bitcoin Market Capitalization: $237 billion
- Bitcoin Dominance: 60.1%


