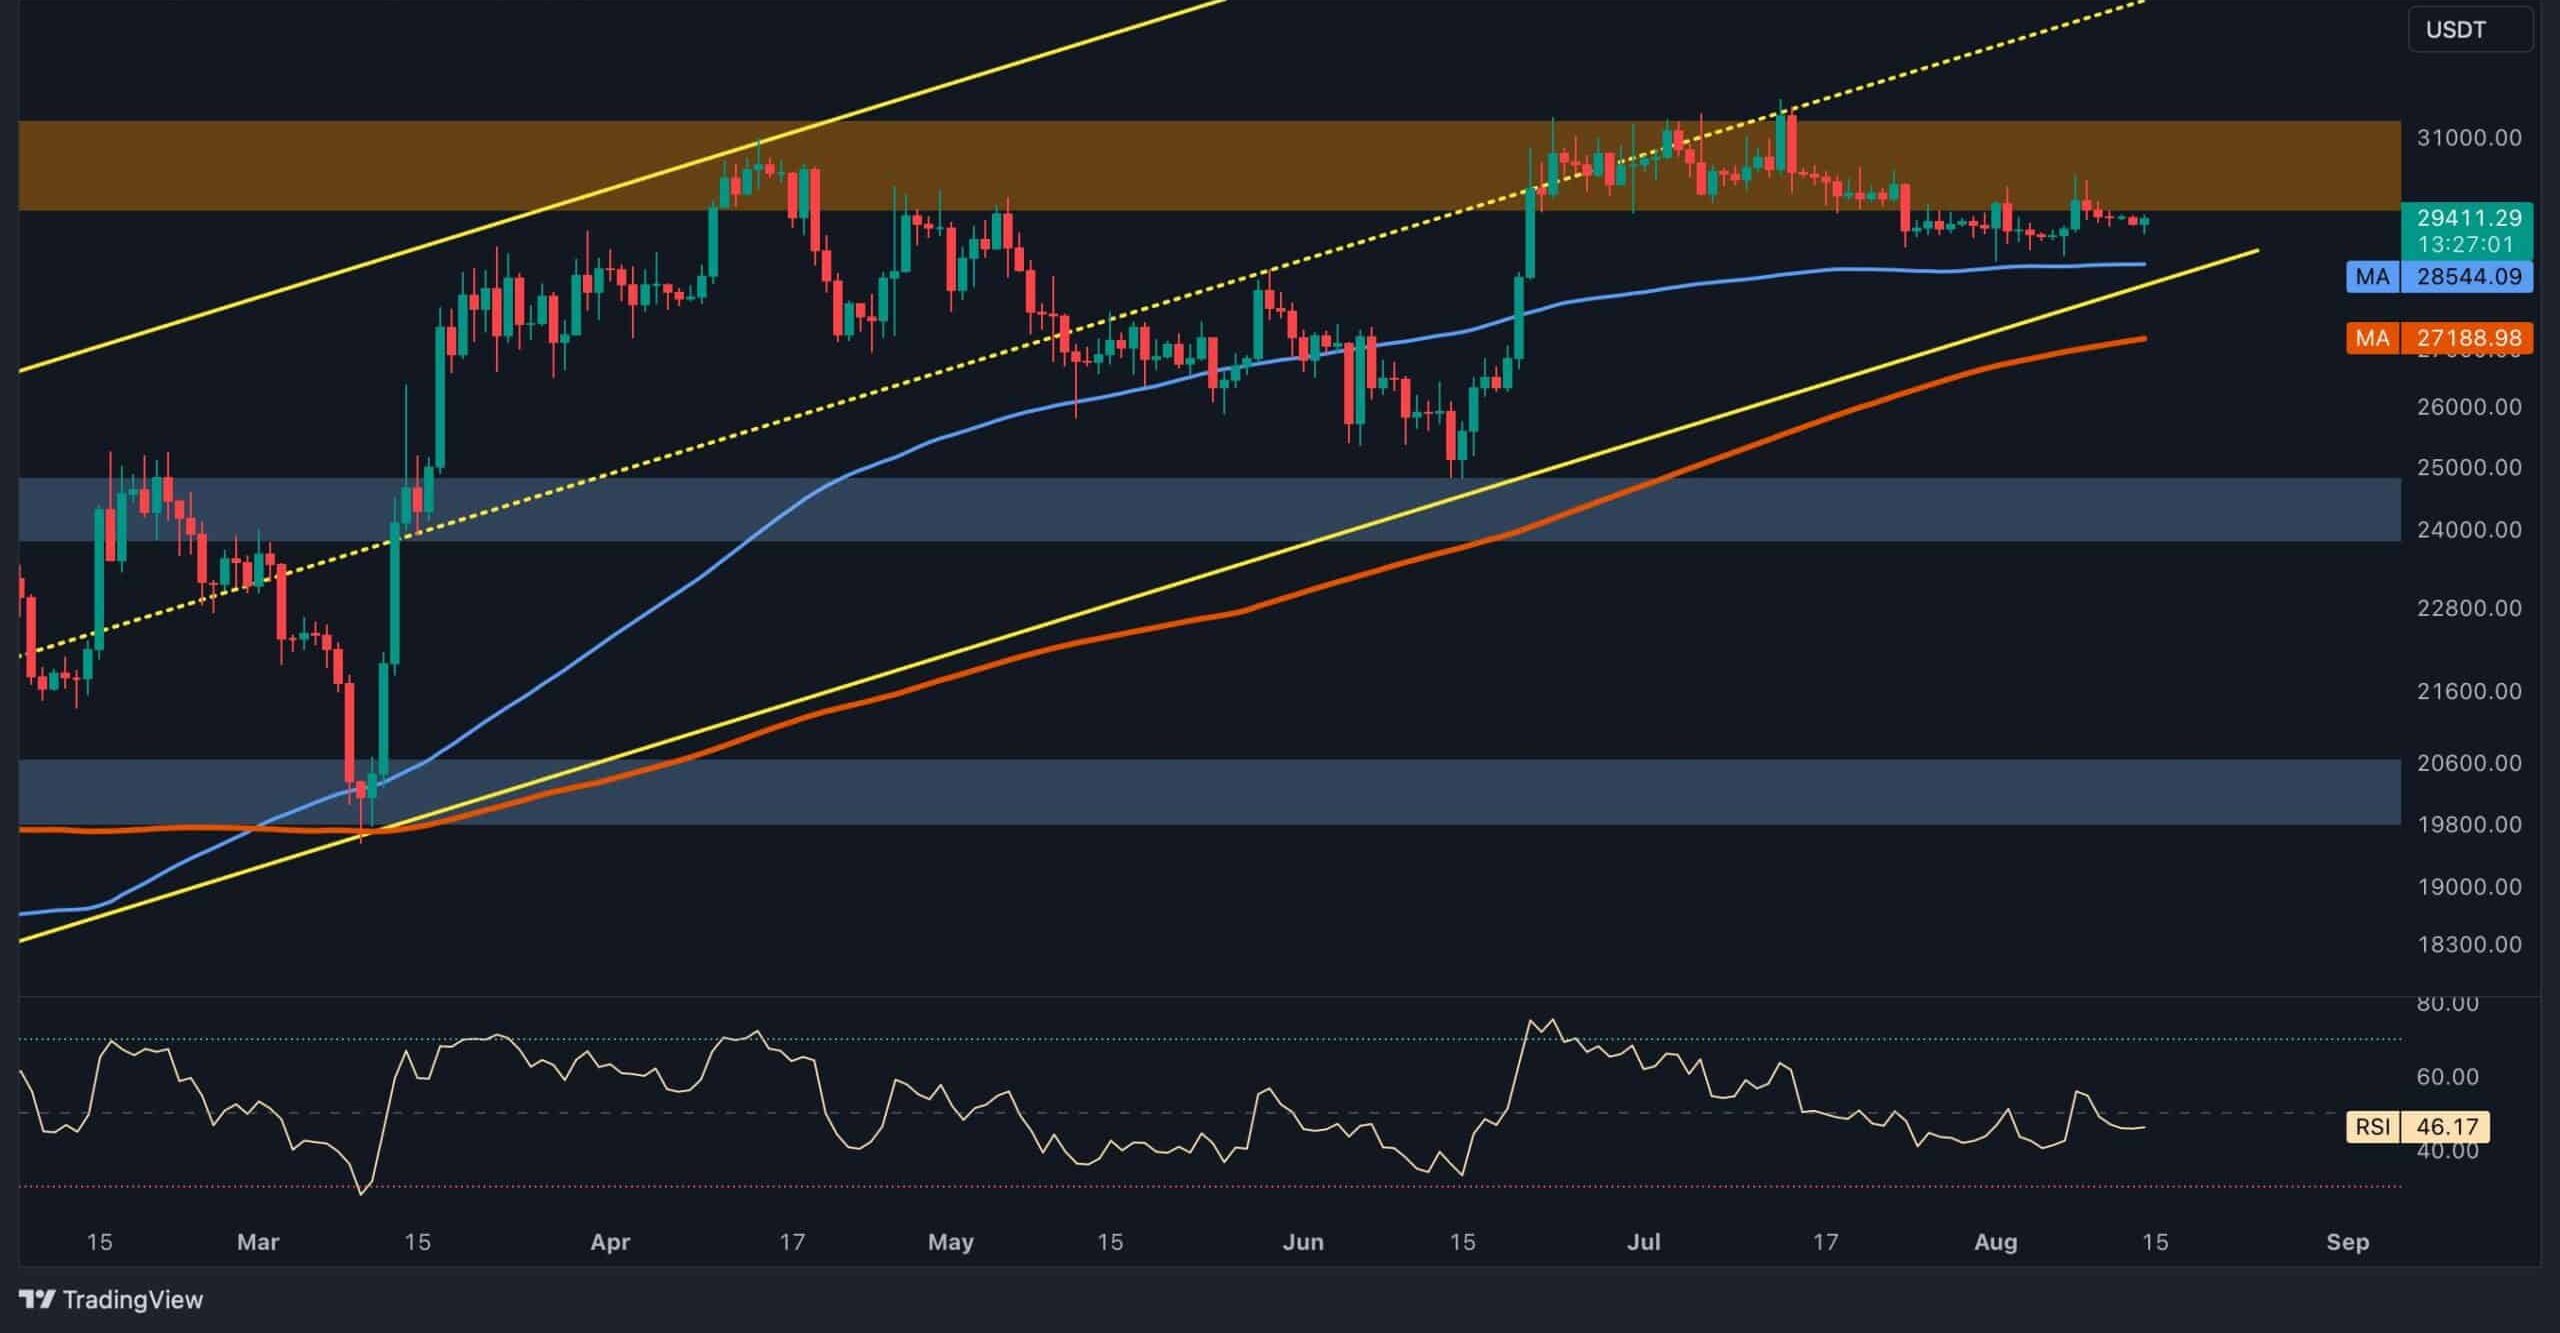
Bitcoin has entered a mild corrective phase characterized by reduced volatility and stagnant price movement since early July. The 100-day moving average at $28,544 and the lower boundary of a multi-month ascending channel at approximately $28,500 now form a critical support zone.
This range is pivotal in determining whether Bitcoin will sustain its current price levels or experience further declines. The presence of small, indecisive candles suggests market participants remain uncertain. A rebound from this support area could trigger renewed buying pressure, potentially setting the stage for a reversal toward the $30,000 resistance.
However, a failure to hold this support could lead to a breach, opening the door to a sharper decline toward the $25,000 support zone.
The 4-Hour Chart
On the shorter timeframe, Bitcoin’s price remains range-bound between $28,000 and $30,000. It is currently consolidating near the critical 0.5 Fibonacci retracement level, a zone that often acts as a midpoint in corrective movements.
If the price holds above the 0.5 Fibonacci level and receives sufficient buying momentum, it may initiate an upward trend targeting the $30,000 resistance. Conversely, a breakdown below the 0.618 Fibonacci retracement level could accelerate selling pressure, driving the price down to the $25,000 support region.
Bitcoin Coinbase Premium Index
Behind Bitcoin’s stagnant price lies notable activity reflected in the Coinbase premium index. This metric gauges the difference between the price of Bitcoin on Coinbase (USD pair) and Binance (USDT pair). Negative values indicate selling pressure from US investors, including institutions and high-net-worth individuals.
Recent data reveals consistent negative values for this index, signaling that US investors are offloading Bitcoin. If this trend persists and Bitcoin fails to break above the $30,000 resistance, excess supply from these sell-offs could trigger a downward reversal in the near term.


