Ethereum has experienced another sharp decline, dropping 15% in the last 24 hours and settling around the $1,200 mark. The overall cryptocurrency market capitalization has fallen below $1 trillion, reflecting widespread losses across the sector.
Technical Analysis
Daily Chart
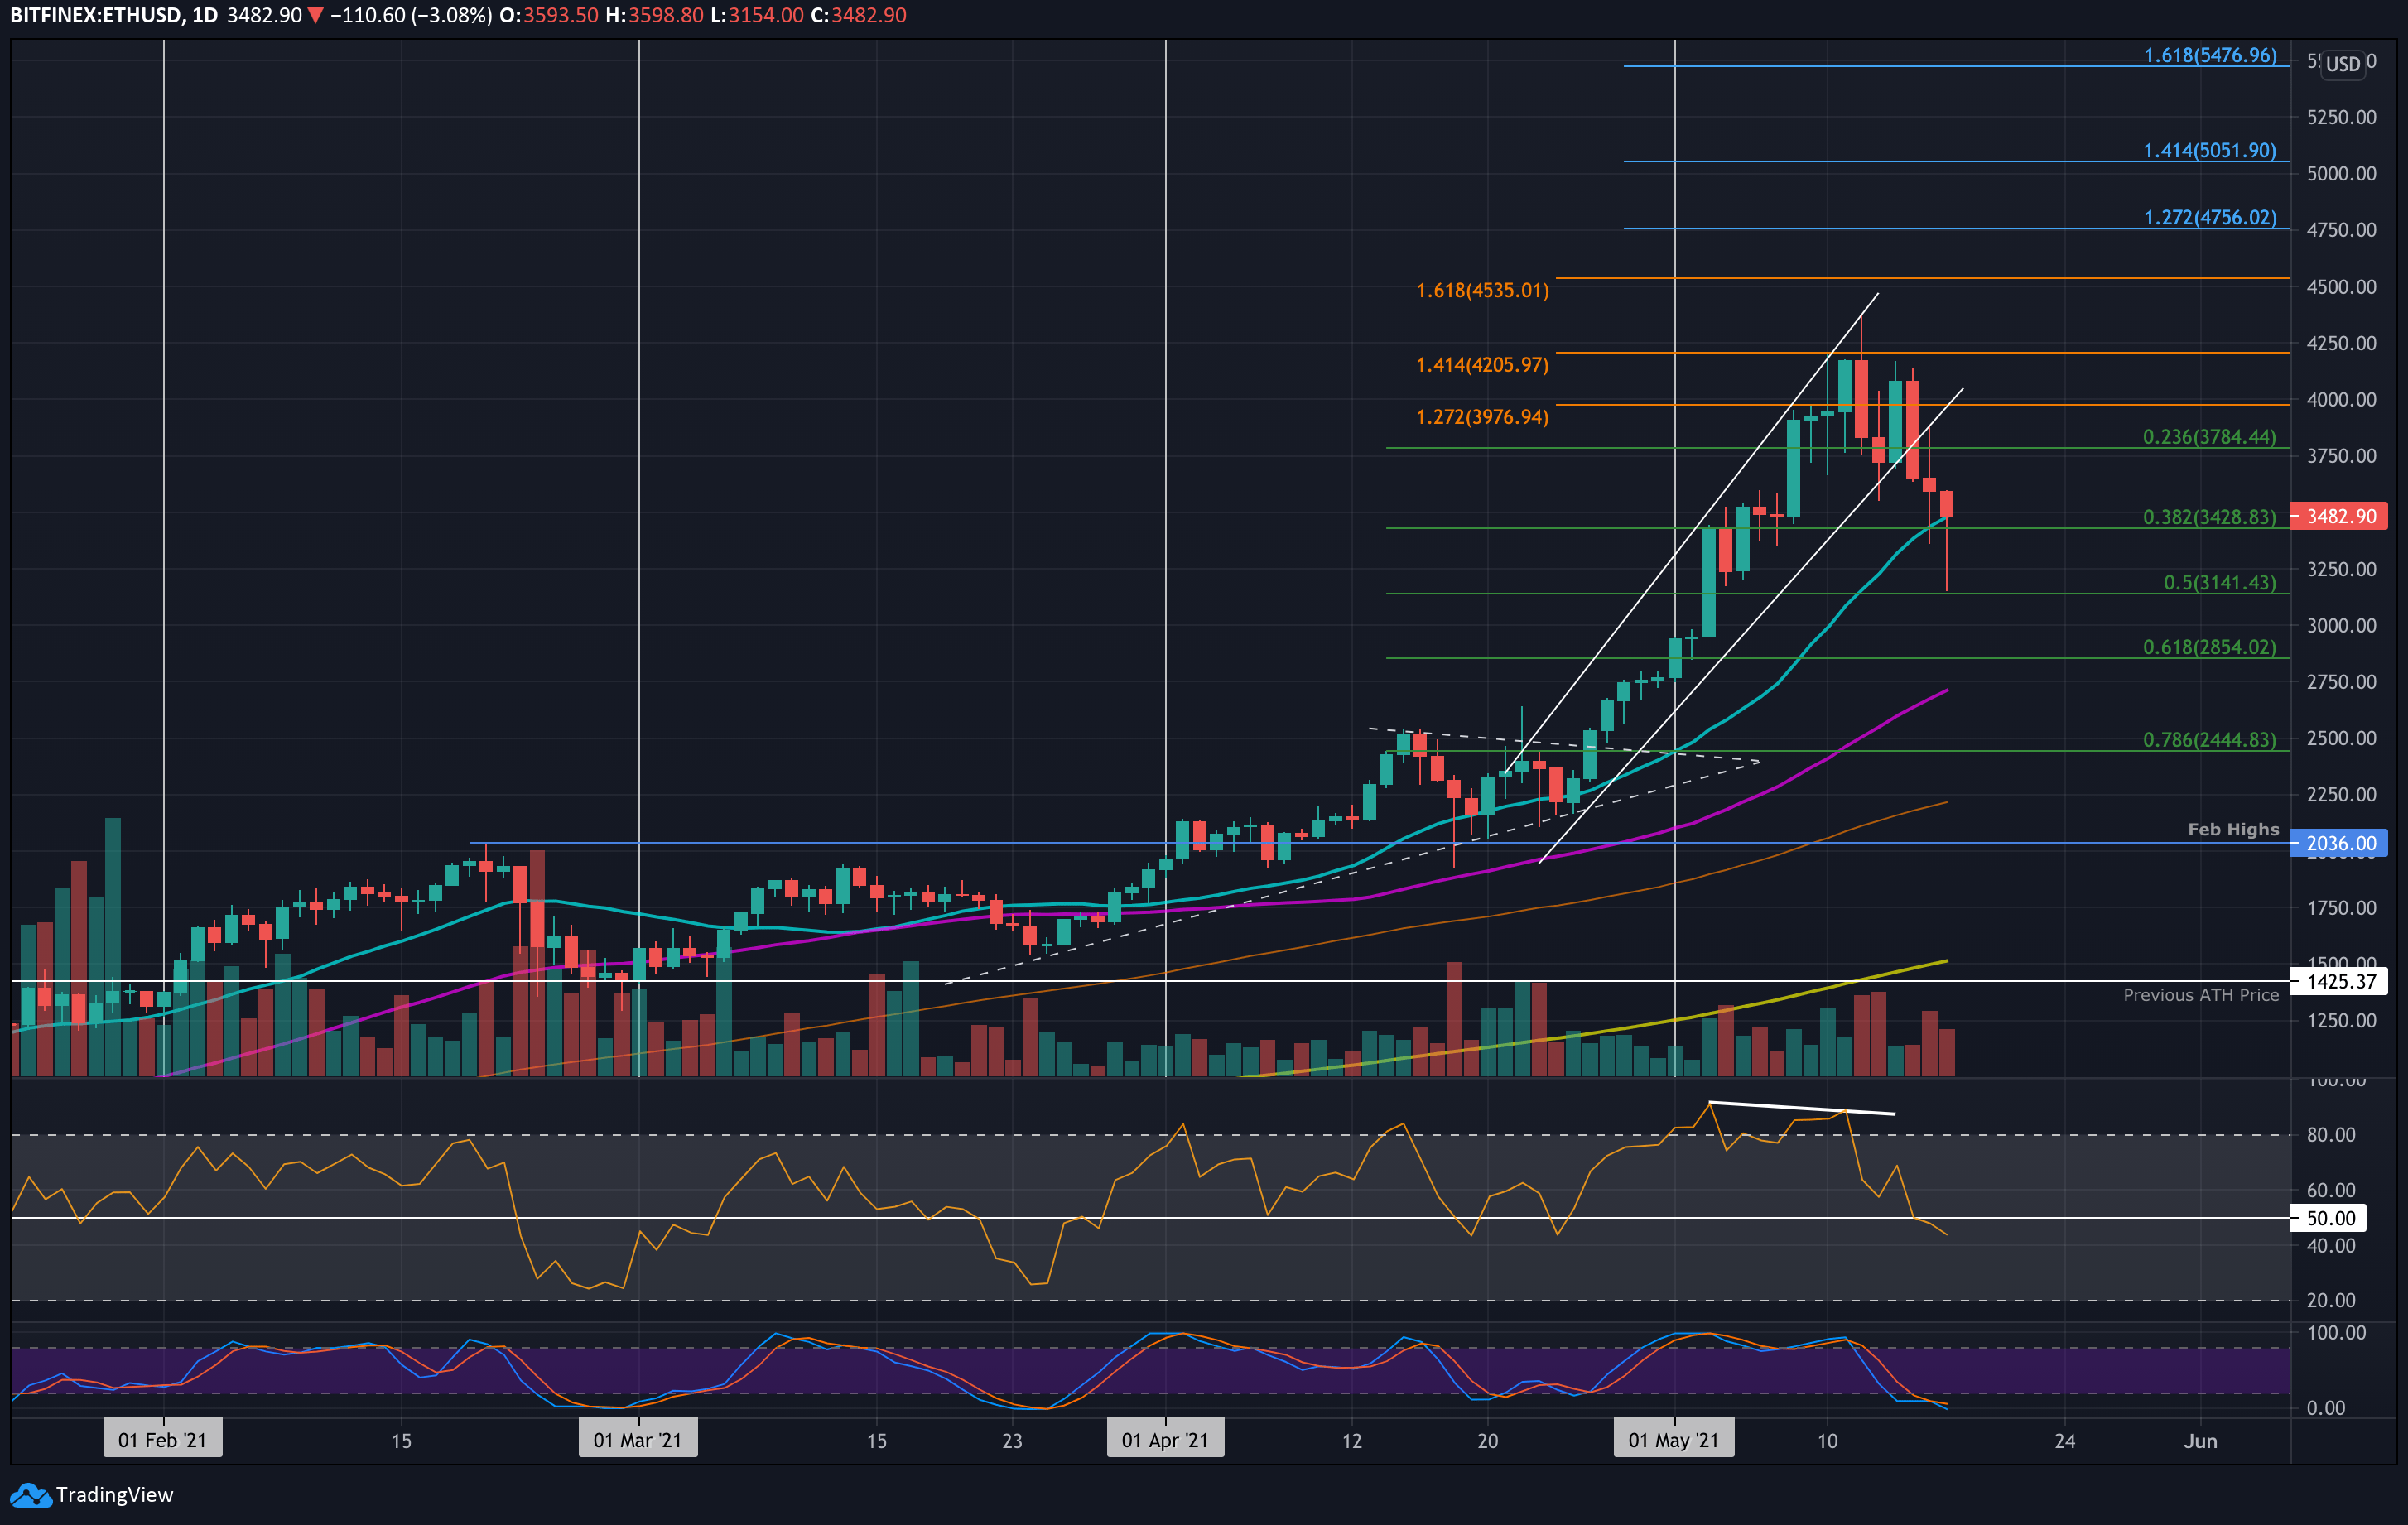
On the daily timeframe, Ethereum lost the $1,300-$1,500 range, a significant demand zone, under intense selling pressure. A Fibonacci Retracement analysis from the COVID-19 crash low to the all-time high highlights critical support and resistance levels.
The first major support at the 0.236 Fibonacci level, located around $2,000, has already been breached following multiple failed attempts to close above it. The price is now nearing the next support at the 0.382 Fibonacci level, approximately $1,100. Below this, additional supports are at $700 (50% retracement of the upward trend) and the golden Fibonacci level at $460 (0.618).
It’s worth noting that this sharp decline may be tied to specific events rather than broader macroeconomic factors. For instance, developments surrounding the Celsius Network are closely watched and could significantly influence Ethereum’s price trajectory.
Moving Averages:
MA20: $1,758
MA50: $2,143
MA100: $2,579
MA200: $2,968
ETH/BTC Chart
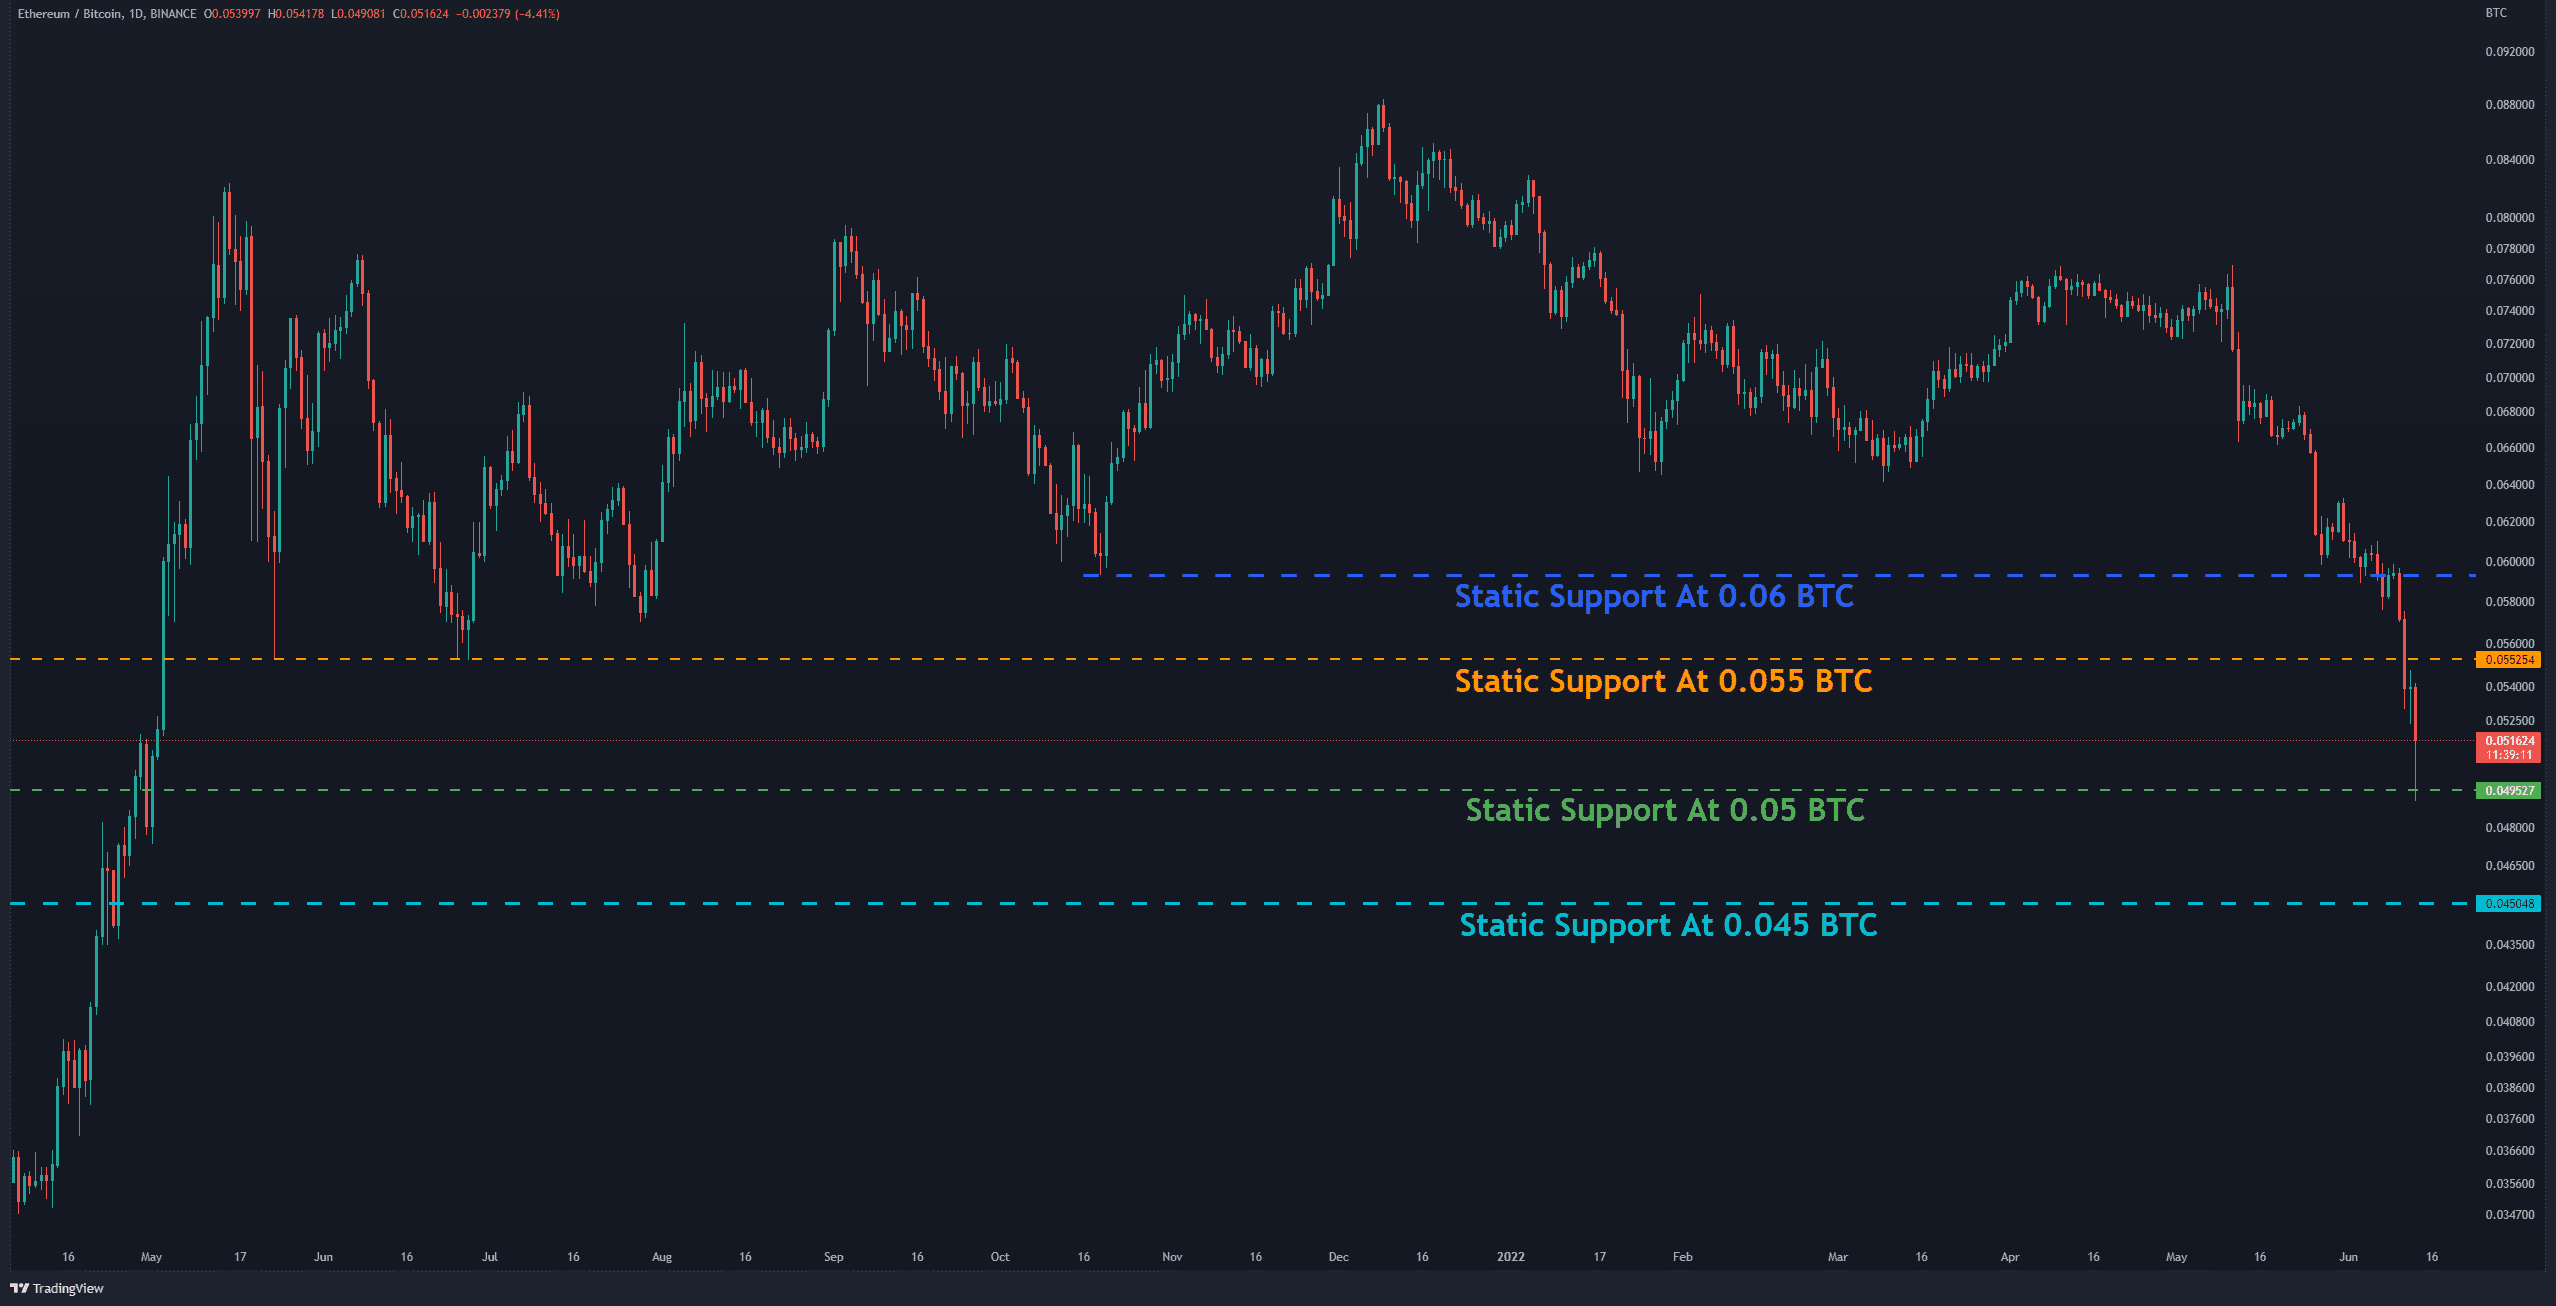
Ethereum is also struggling in its performance against Bitcoin. Recently, one of the largest red candlesticks formed on the ETH/BTC chart. At the time of writing, Ethereum has tested horizontal support at 0.05 BTC, which buyers have managed to hold temporarily. However, if bearish momentum persists, the next key support is located at 0.045 BTC, making this a likely target given the current sentiment.
Market Sentiment
Bearish sentiment remains dominant in both ETH/USD and ETH/BTC pairs, with the market still searching for a stable support zone.