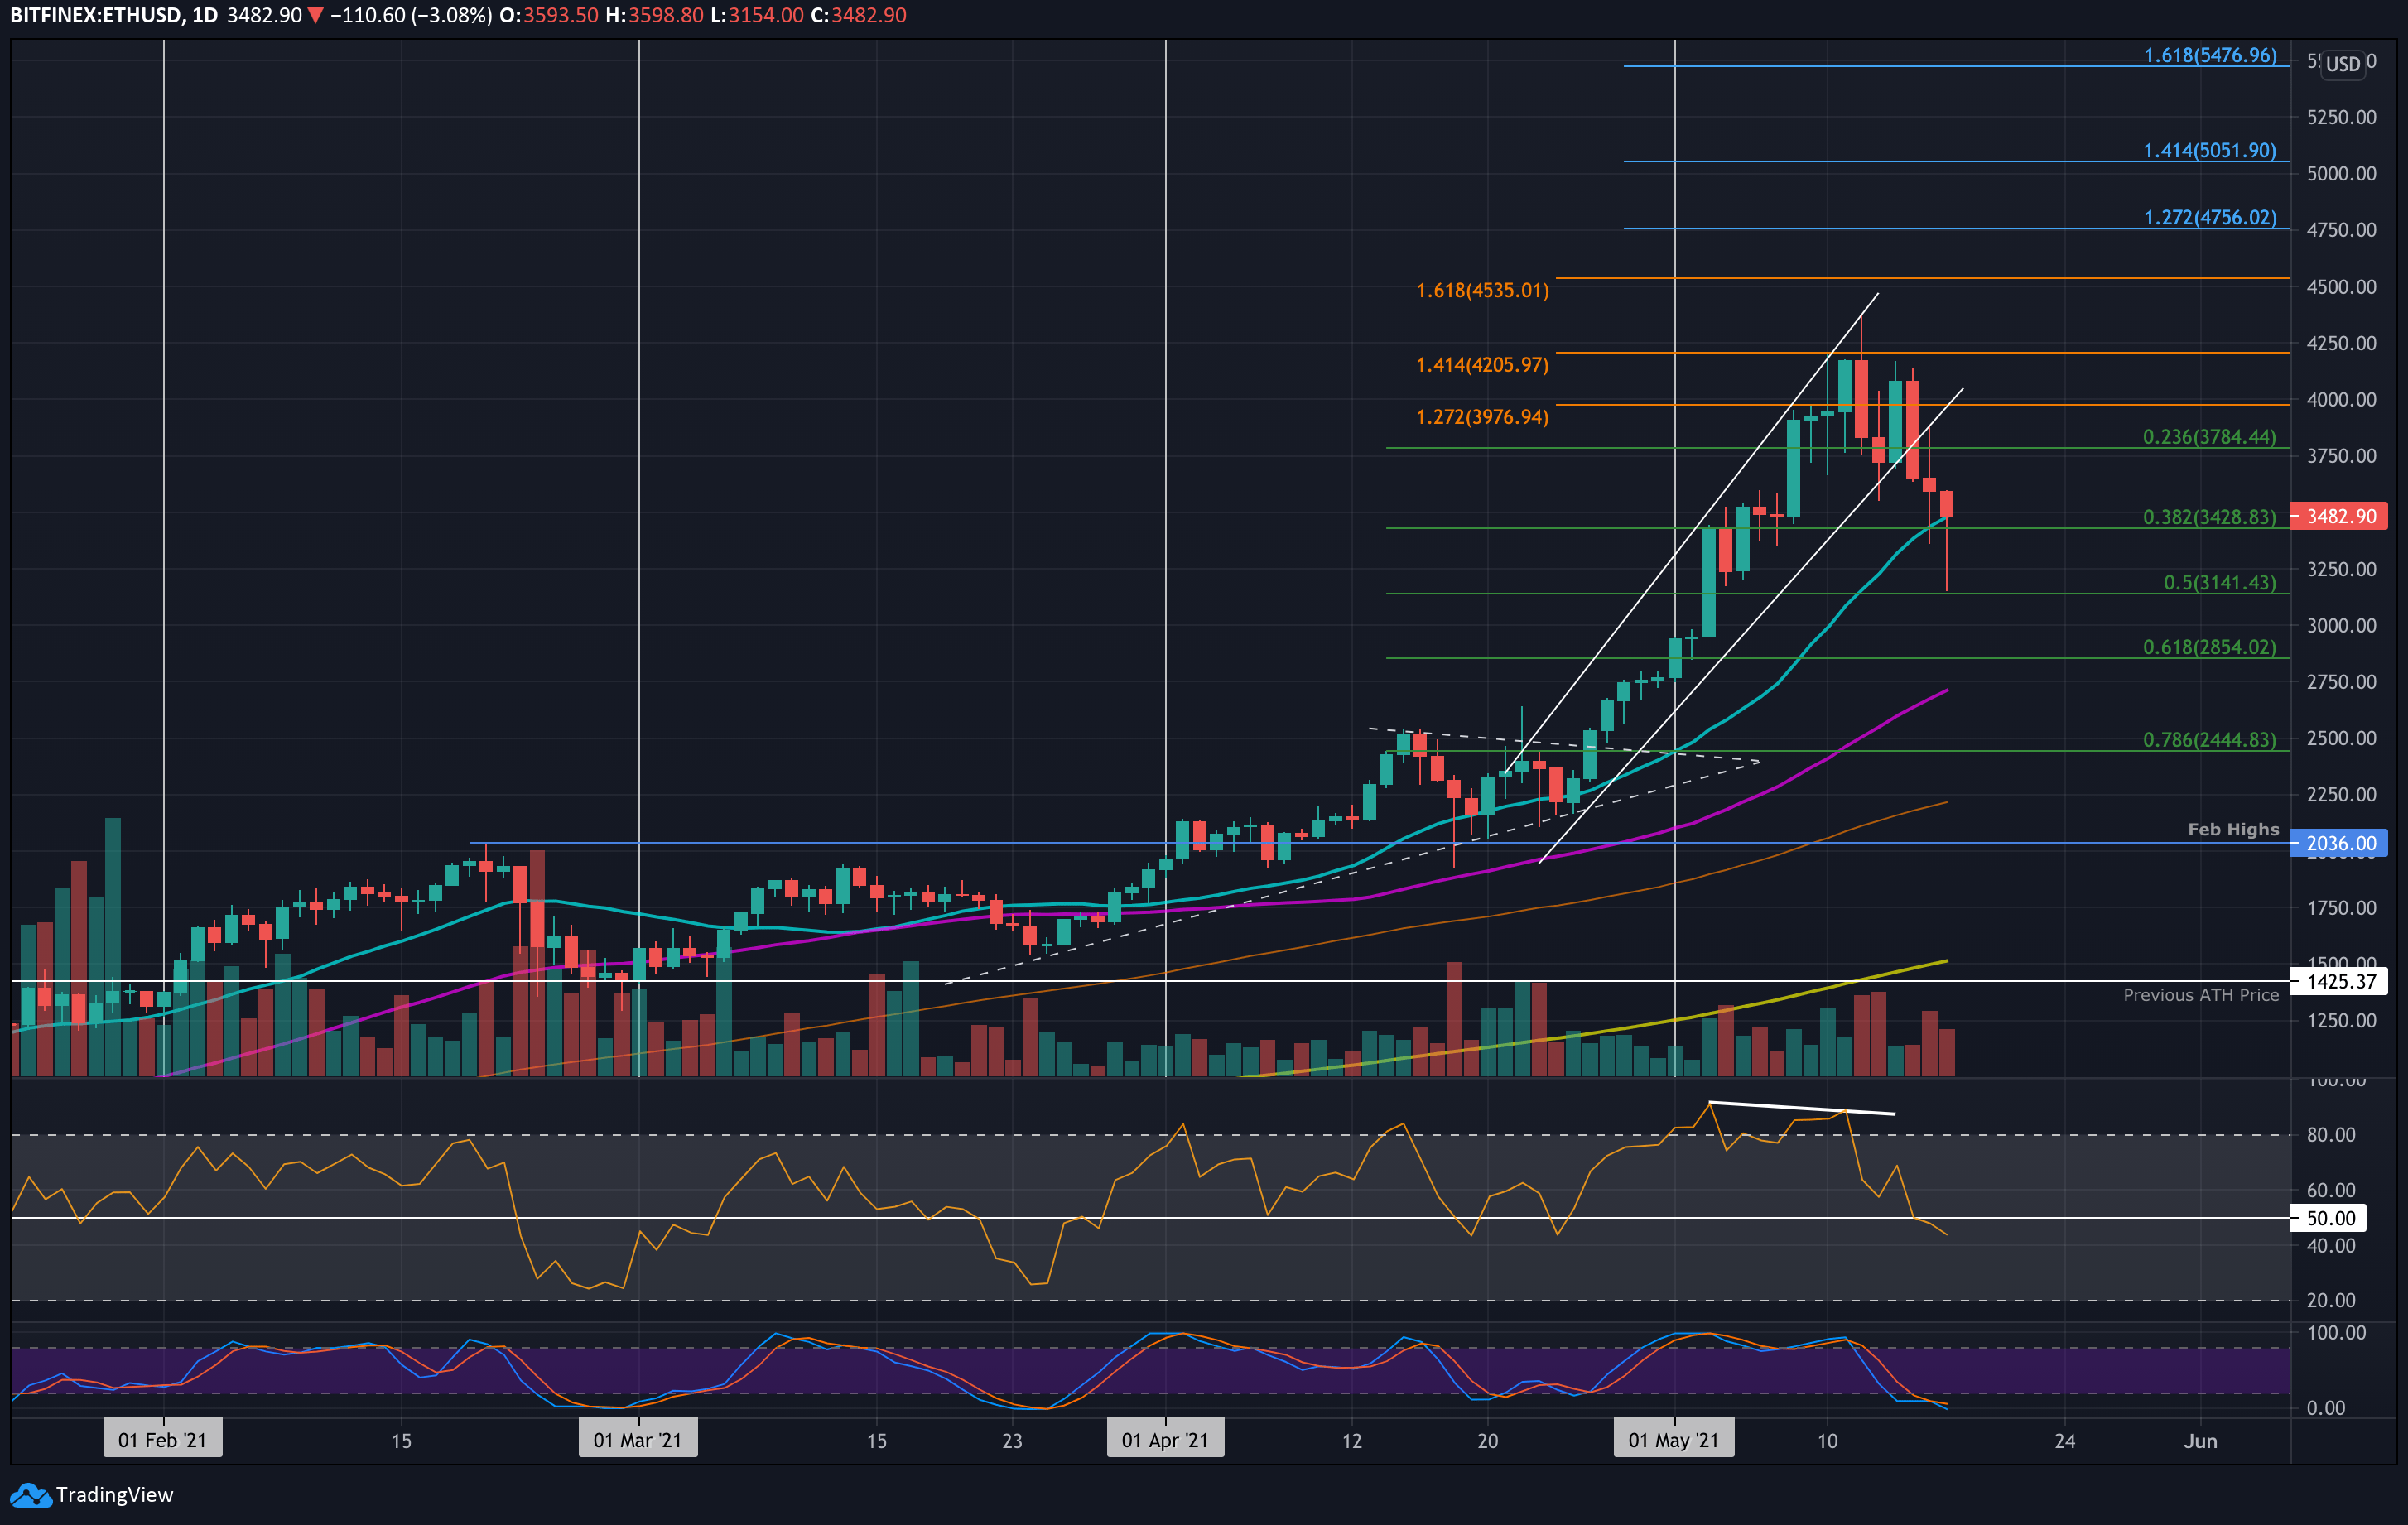
Ethereum has experienced a sharp 10% decline today, reaching a low of $3141. When measured against Bitcoin, ETH has fallen out of its upward price channel and is struggling to maintain support at 0.077 BTC.
Ethereum broke beneath its ascending price channel over the weekend, sliding from above $4000 and continuing lower into Saturday. This price channel had been in place since late April, fueling Ethereum’s strong bull run over the past two weeks, which culminated in an all-time high of $4373.
Today, Ethereum continued its downward movement, hitting a low of $3141, where it found temporary support at the .5 Fibonacci retracement level. The price has since bounced back, managing to rise above the 20-day moving average, which is currently around $3480.
If the selling pressure breaks the 20-day moving average, the next support level will be at $3430 ( .382 Fibonacci). Additional support is found at $3250, $3141 ( .5 Fibonacci), $3000, and $2855 ( .618 Fibonacci).
On the upside, the first significant resistance lies at $3750, followed by $3800, $4000, and $4200.
The Relative Strength Index (RSI) recently dropped below the midline, suggesting that bearish momentum is growing. If the RSI continues to decline, Ethereum may see further price drops toward the $3000 level.
Ethereum hit a new all-time high against Bitcoin on Friday, reaching 0.0822 BTC. However, momentum quickly slowed, and Ethereum slipped into the lower part of its rising price channel.
Yesterday, the price dipped below this channel but managed to close above the 0.077 BTC support level. Today, Ethereum fell as low as 0.0739 BTC ( .236 Fibonacci) but has rebounded above 0.077 BTC as bulls continue to defend this critical support zone.
The first strong support lies at 0.0739 BTC ( .236 Fibonacci), followed by 0.0689 BTC ( .382 Fibonacci), 0.065 BTC ( .5 Fibonacci & 20-day moving average), and 0.0607 BTC ( .618 Fibonacci).
On the resistance side, the first significant level is at 0.08 BTC, followed by the ATH at 0.0822 BTC, 0.0838 BTC (1.618 Fibonacci extension), 0.0877 BTC, and 0.09 BTC.
The RSI has started to dip, but it remains above the midpoint, indicating that buyers still control the market momentum for now.


