Ethereum continues to face significant challenges at a critical support zone, with all recent attempts at establishing an uptrend on lower timeframes being rejected.
Daily Chart
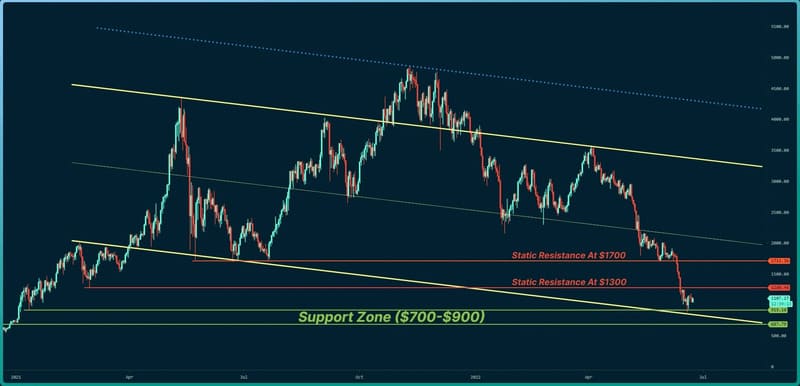
On the daily timeframe, the bulls have managed to defend the support zone at $900, which extends between $900 and $700 (highlighted in green). Ethereum is currently trading within a descending channel, having reached the lower boundary of this channel.
If selling pressure intensifies, ETH may revisit the bottom of the channel near $700 in the coming weeks. However, to initiate a bullish reversal, the price would need to break through the horizontal resistance at $1,300, followed by a push towards $1,700. Only a breakout above this upper level would signal a trend reversal.
Moving Averages:
MA20: $1,392
MA50: $1,793
MA100: $2,432
MA200: $3,044
ETH/BTC Chart
Against Bitcoin, Ethereum is struggling to surpass the first Fibonacci retracement level at 0.236, located around 0.0557 BTC. Support is currently found within the 0.05-0.045 BTC range. Fundamental developments, such as the Merge, could provide the necessary momentum for buyers to return. Until then, significant progress seems unlikely.
On-Chain Analysis
Exchange Netflow (Total)
The on-chain data highlights a continued dominance of selling pressure. High inflows to exchanges have led to an increase in exchange reserves, reflecting ongoing sell-offs. A shift in momentum towards consecutive red histogram bars would signal that buyers are regaining control, potentially reversing the current trend.