Bitcoin has encountered a crucial resistance zone following a period of steady upward movement, where it has been consistently forming higher highs and higher lows. This key area is where the 100-day and 200-day moving averages meet, and how the price behaves here could set the tone for the upcoming market trend.
The Daily Chart
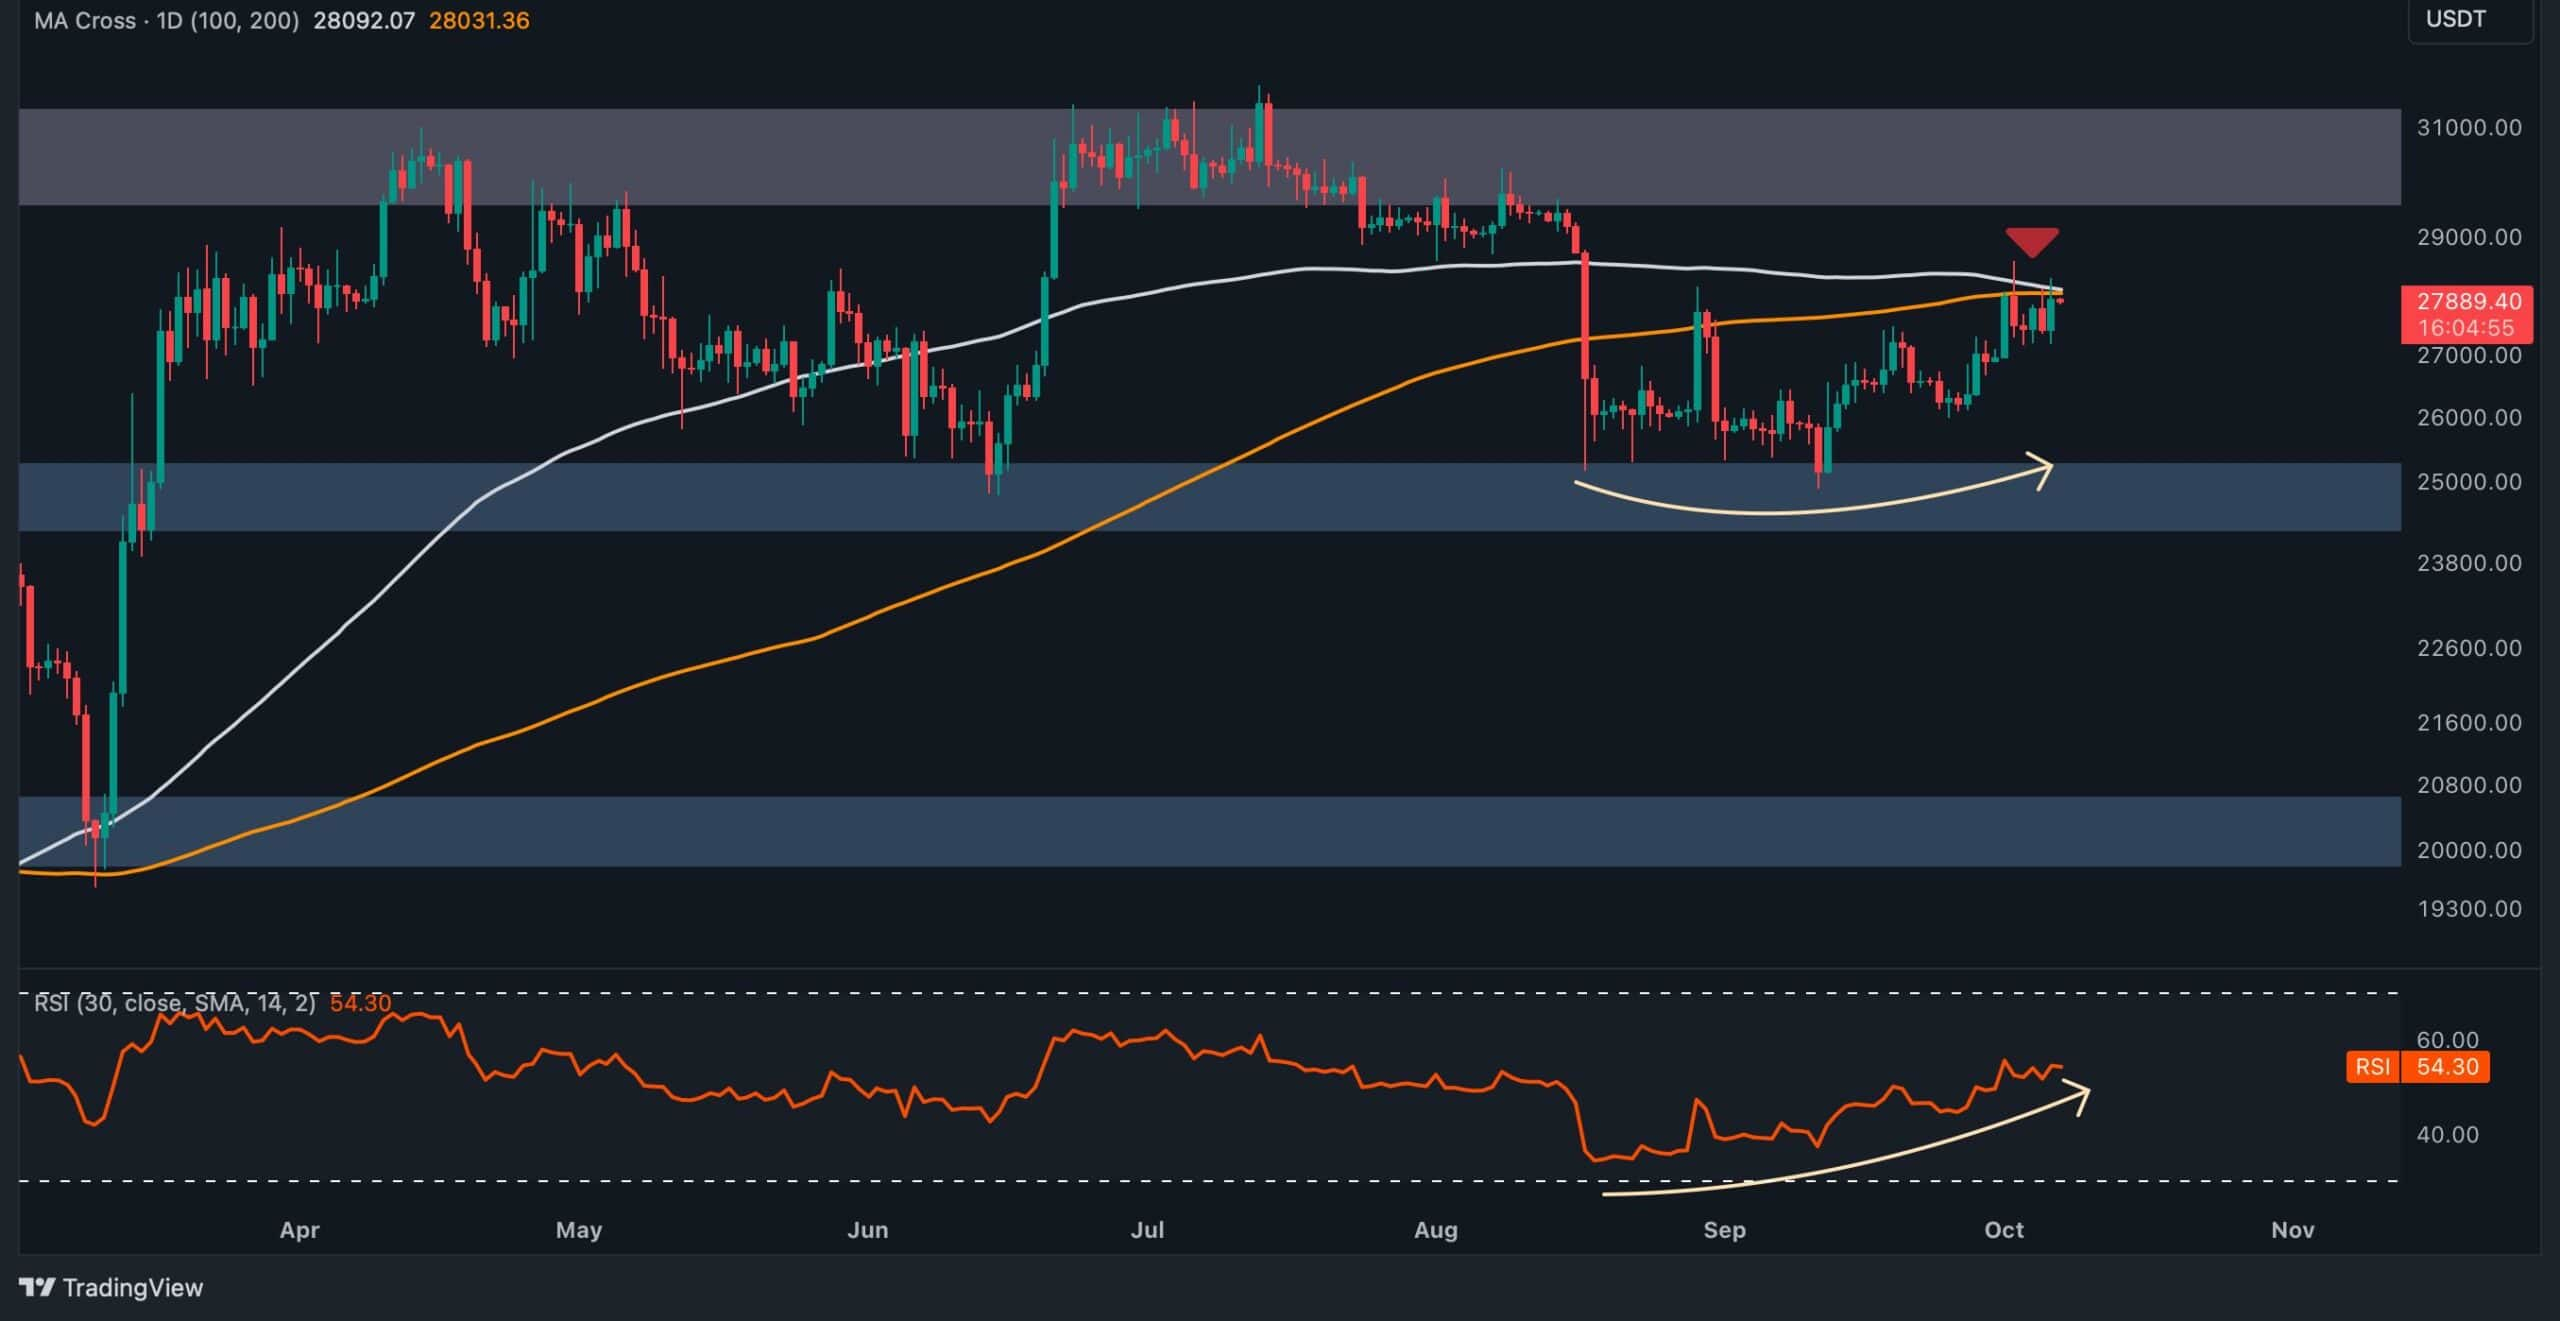
Bitcoin has recently completed a phase of consolidation near the $25,000 level, after which it gained substantial bullish momentum. This upward movement has led the price to approach a significant resistance zone around $28,000, where the 100-day and 200-day moving averages intersect.
Given the significance of this resistance area, there is a strong possibility of a pullback, which could potentially result in a decline towards lower levels. However, a breakout above these moving averages would indicate renewed bullish momentum, opening the door for an upward movement toward the $30,000 mark.
In any case, close attention must be paid to price action in the coming days, as we can expect increased volatility and potential shifts in market sentiment.
The 4-Hour Chart
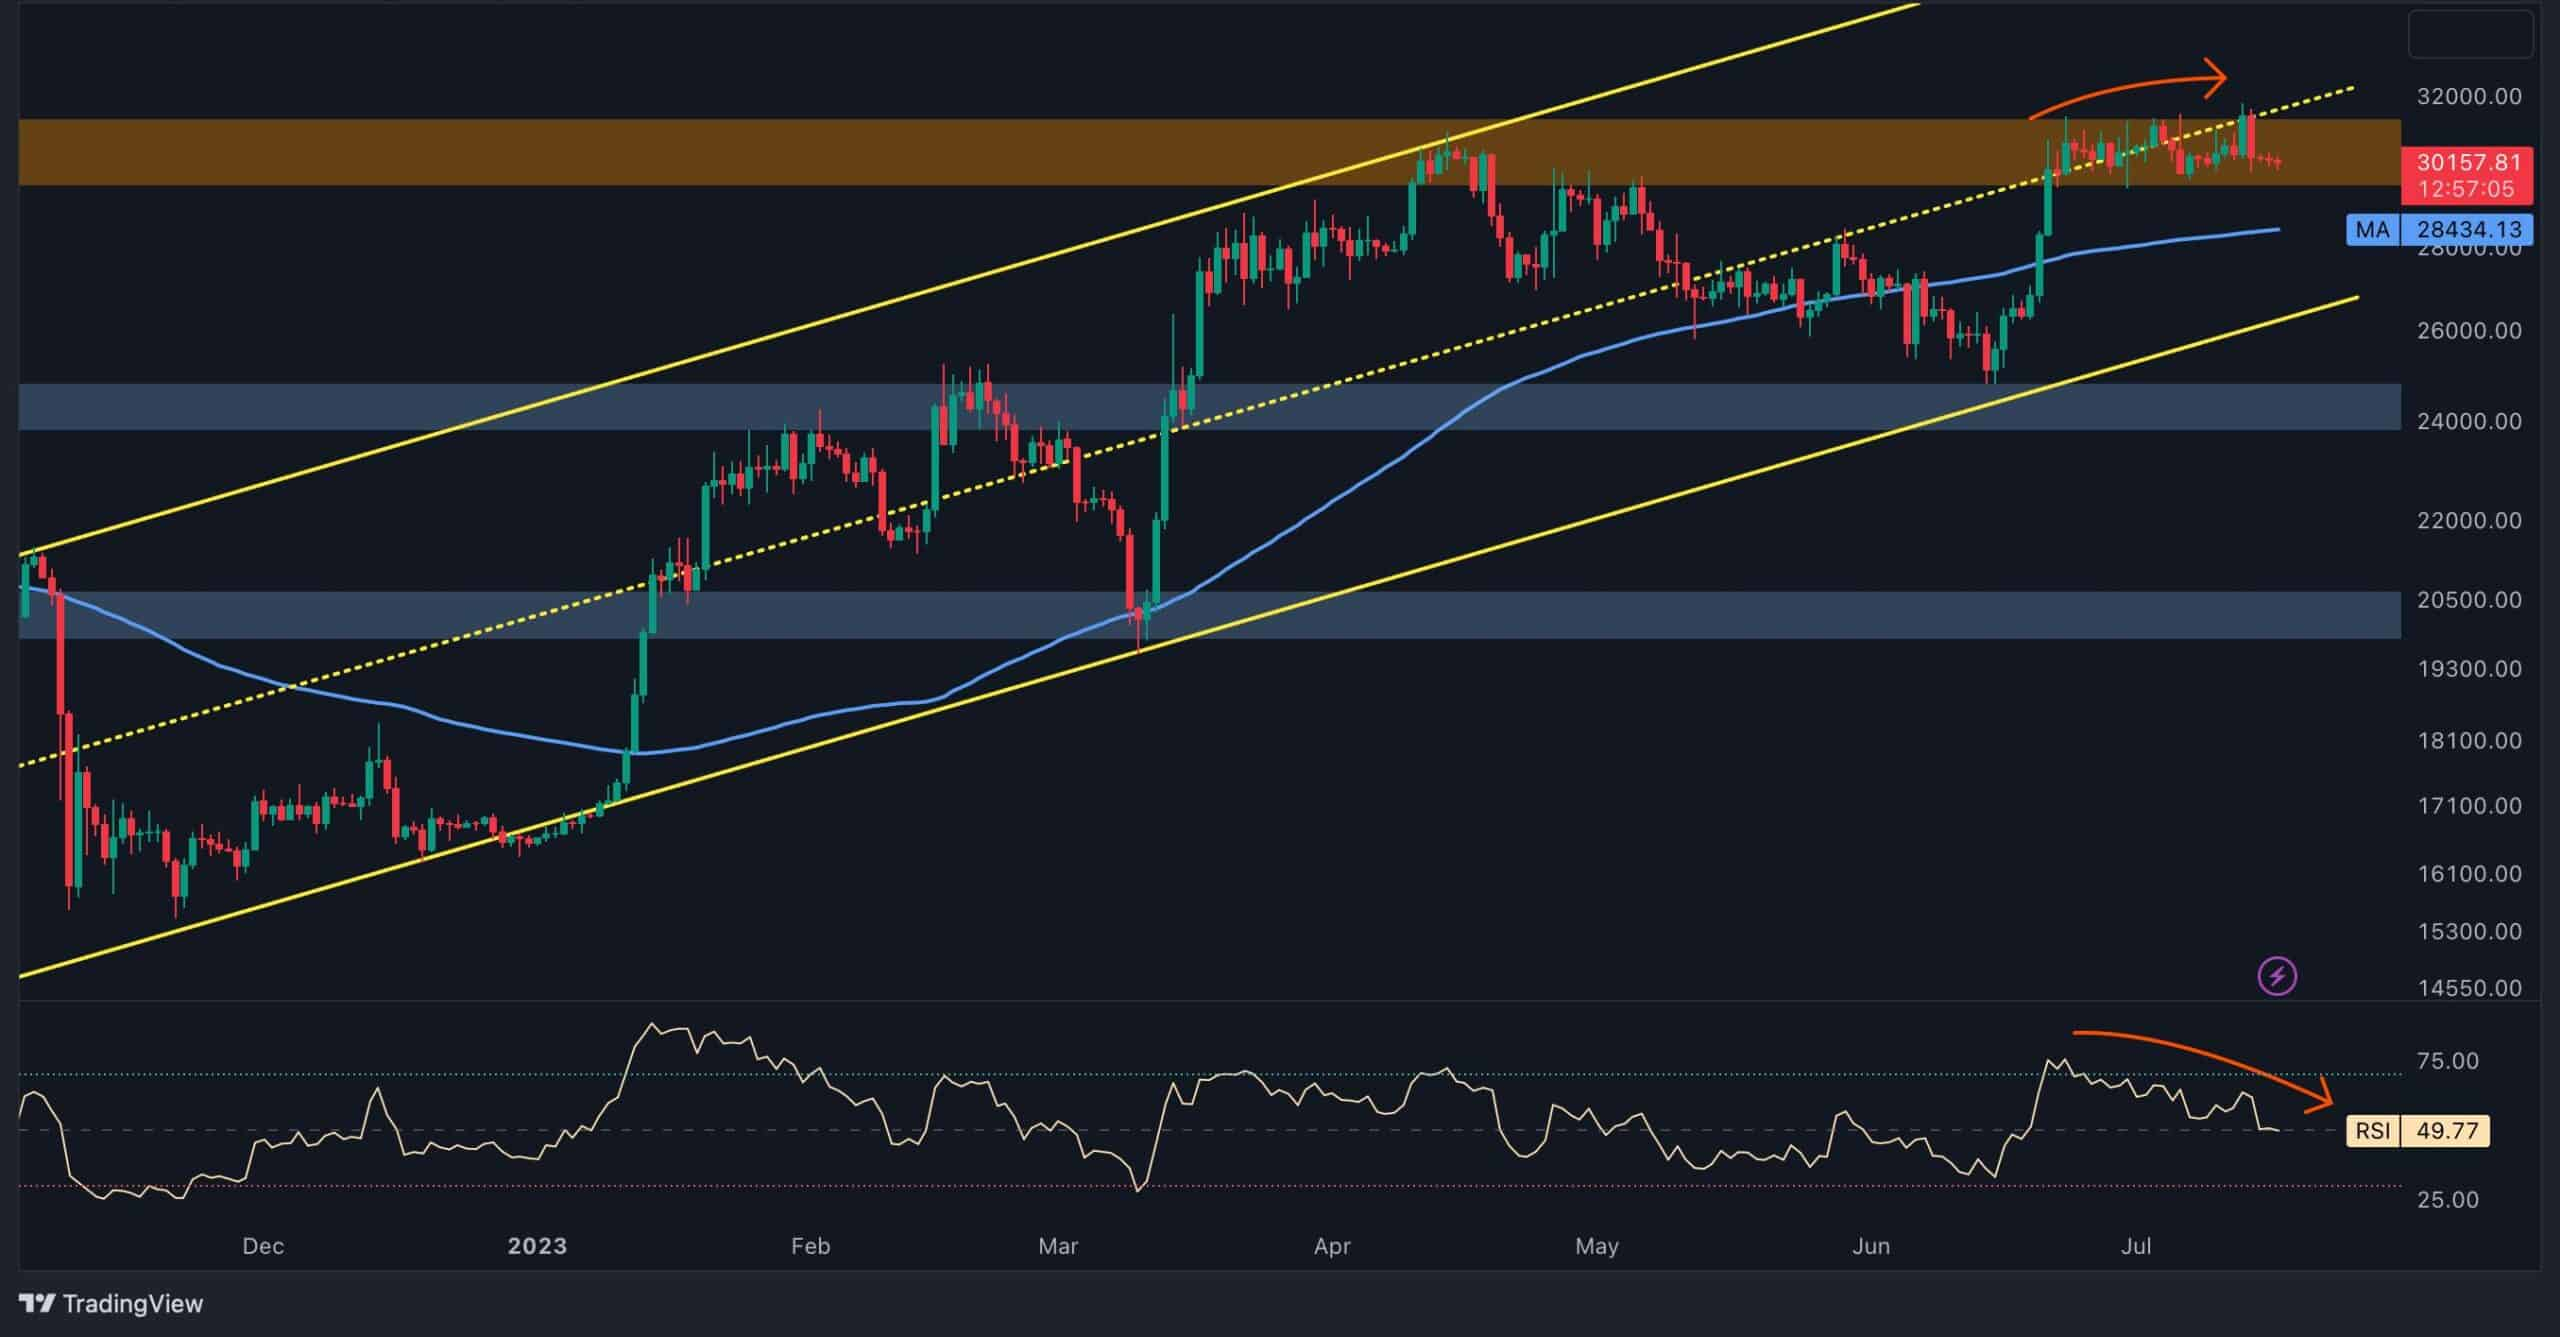
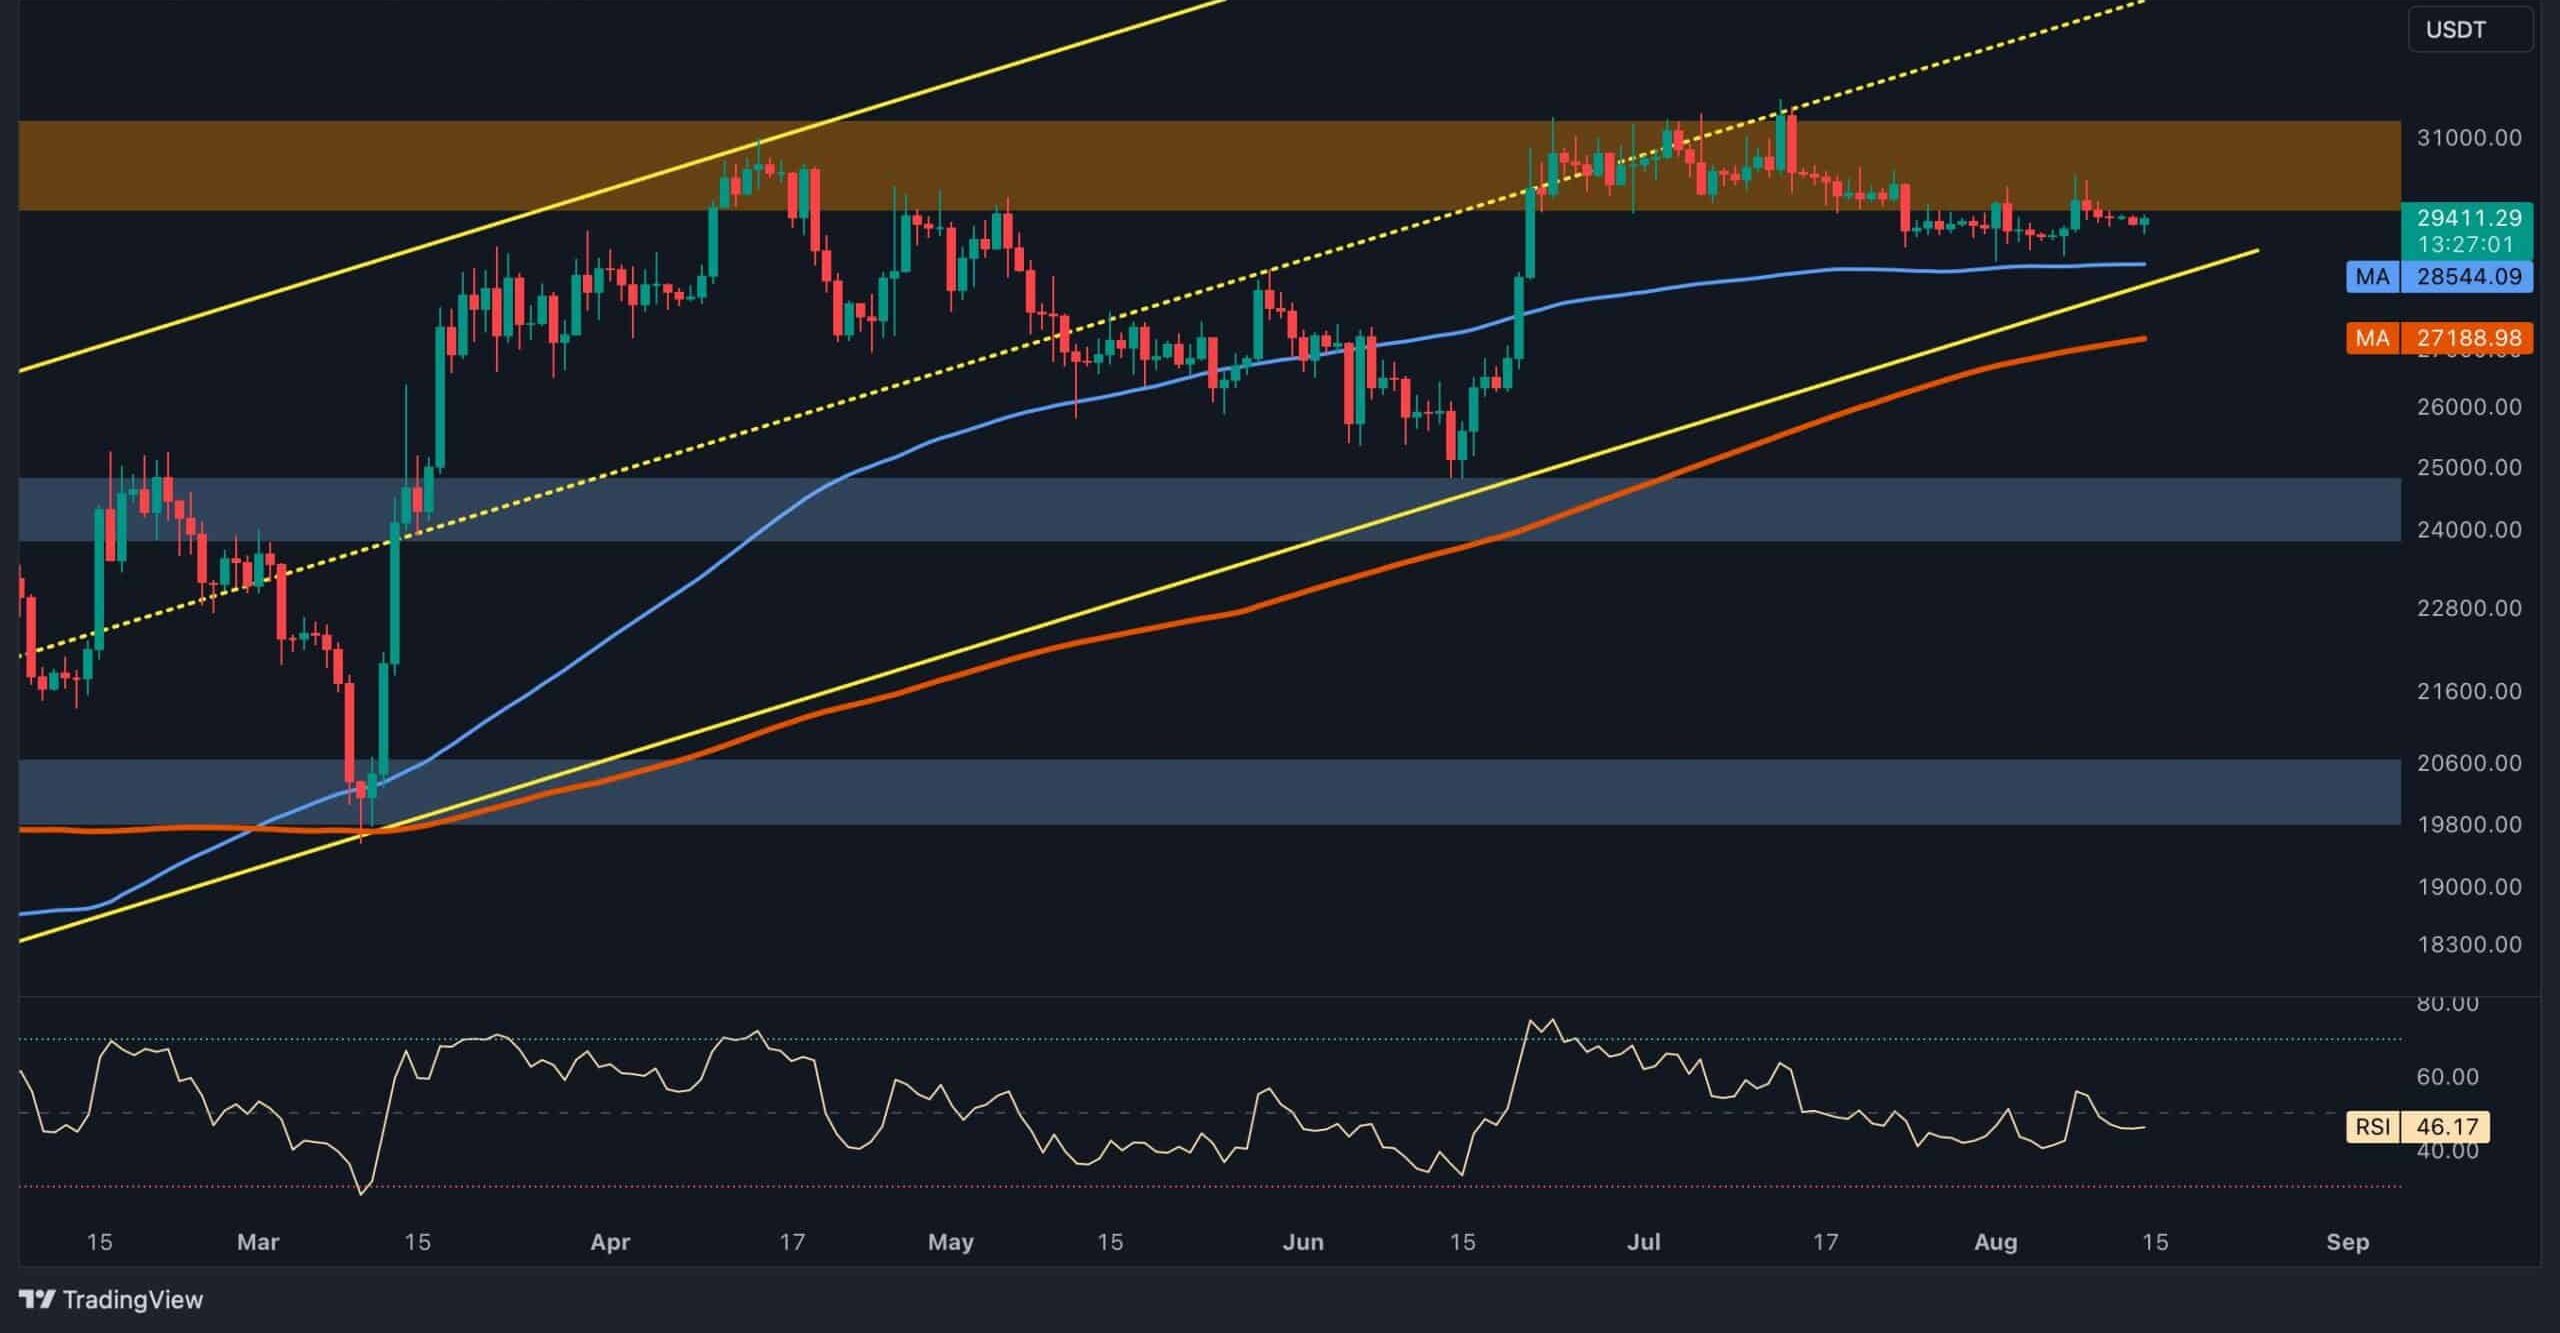
On the 4-hour chart, Bitcoin found solid support at $25,000 after a considerable drop, and the price began rising again. This positive movement has seen the cryptocurrency break past previous highs, suggesting an increase in buyer interest.
However, the price has been moving within an ascending channel and faced rejection from the upper trendline, coinciding with the 0.618 Fibonacci retracement level. This pattern indicates that sellers may be gaining control, and another downward move is plausible in the short term.
Yet, should the price unexpectedly overcome this key resistance area and show signs of strength, it could trigger a sharp upward movement, possibly driving Bitcoin toward the $30,000 zone. The market’s reaction to this critical level will be decisive in determining the short-term price trajectory.
Transaction Count (Mean)
Bitcoin’s recent bounce in price has been accompanied by a noticeable rise in network activity, as seen in the on-chain transaction count. Historical data suggests that an increase in network activity often correlates with rising prices, which makes the current situation noteworthy.
While the transaction count has surged during the price rise towards $30,000, there has been a sharp decline in recent days. This drop is concerning and may signal a potential slowdown in price movement. If network activity fails to pick up again, Bitcoin’s price could face downward pressure in the near term.