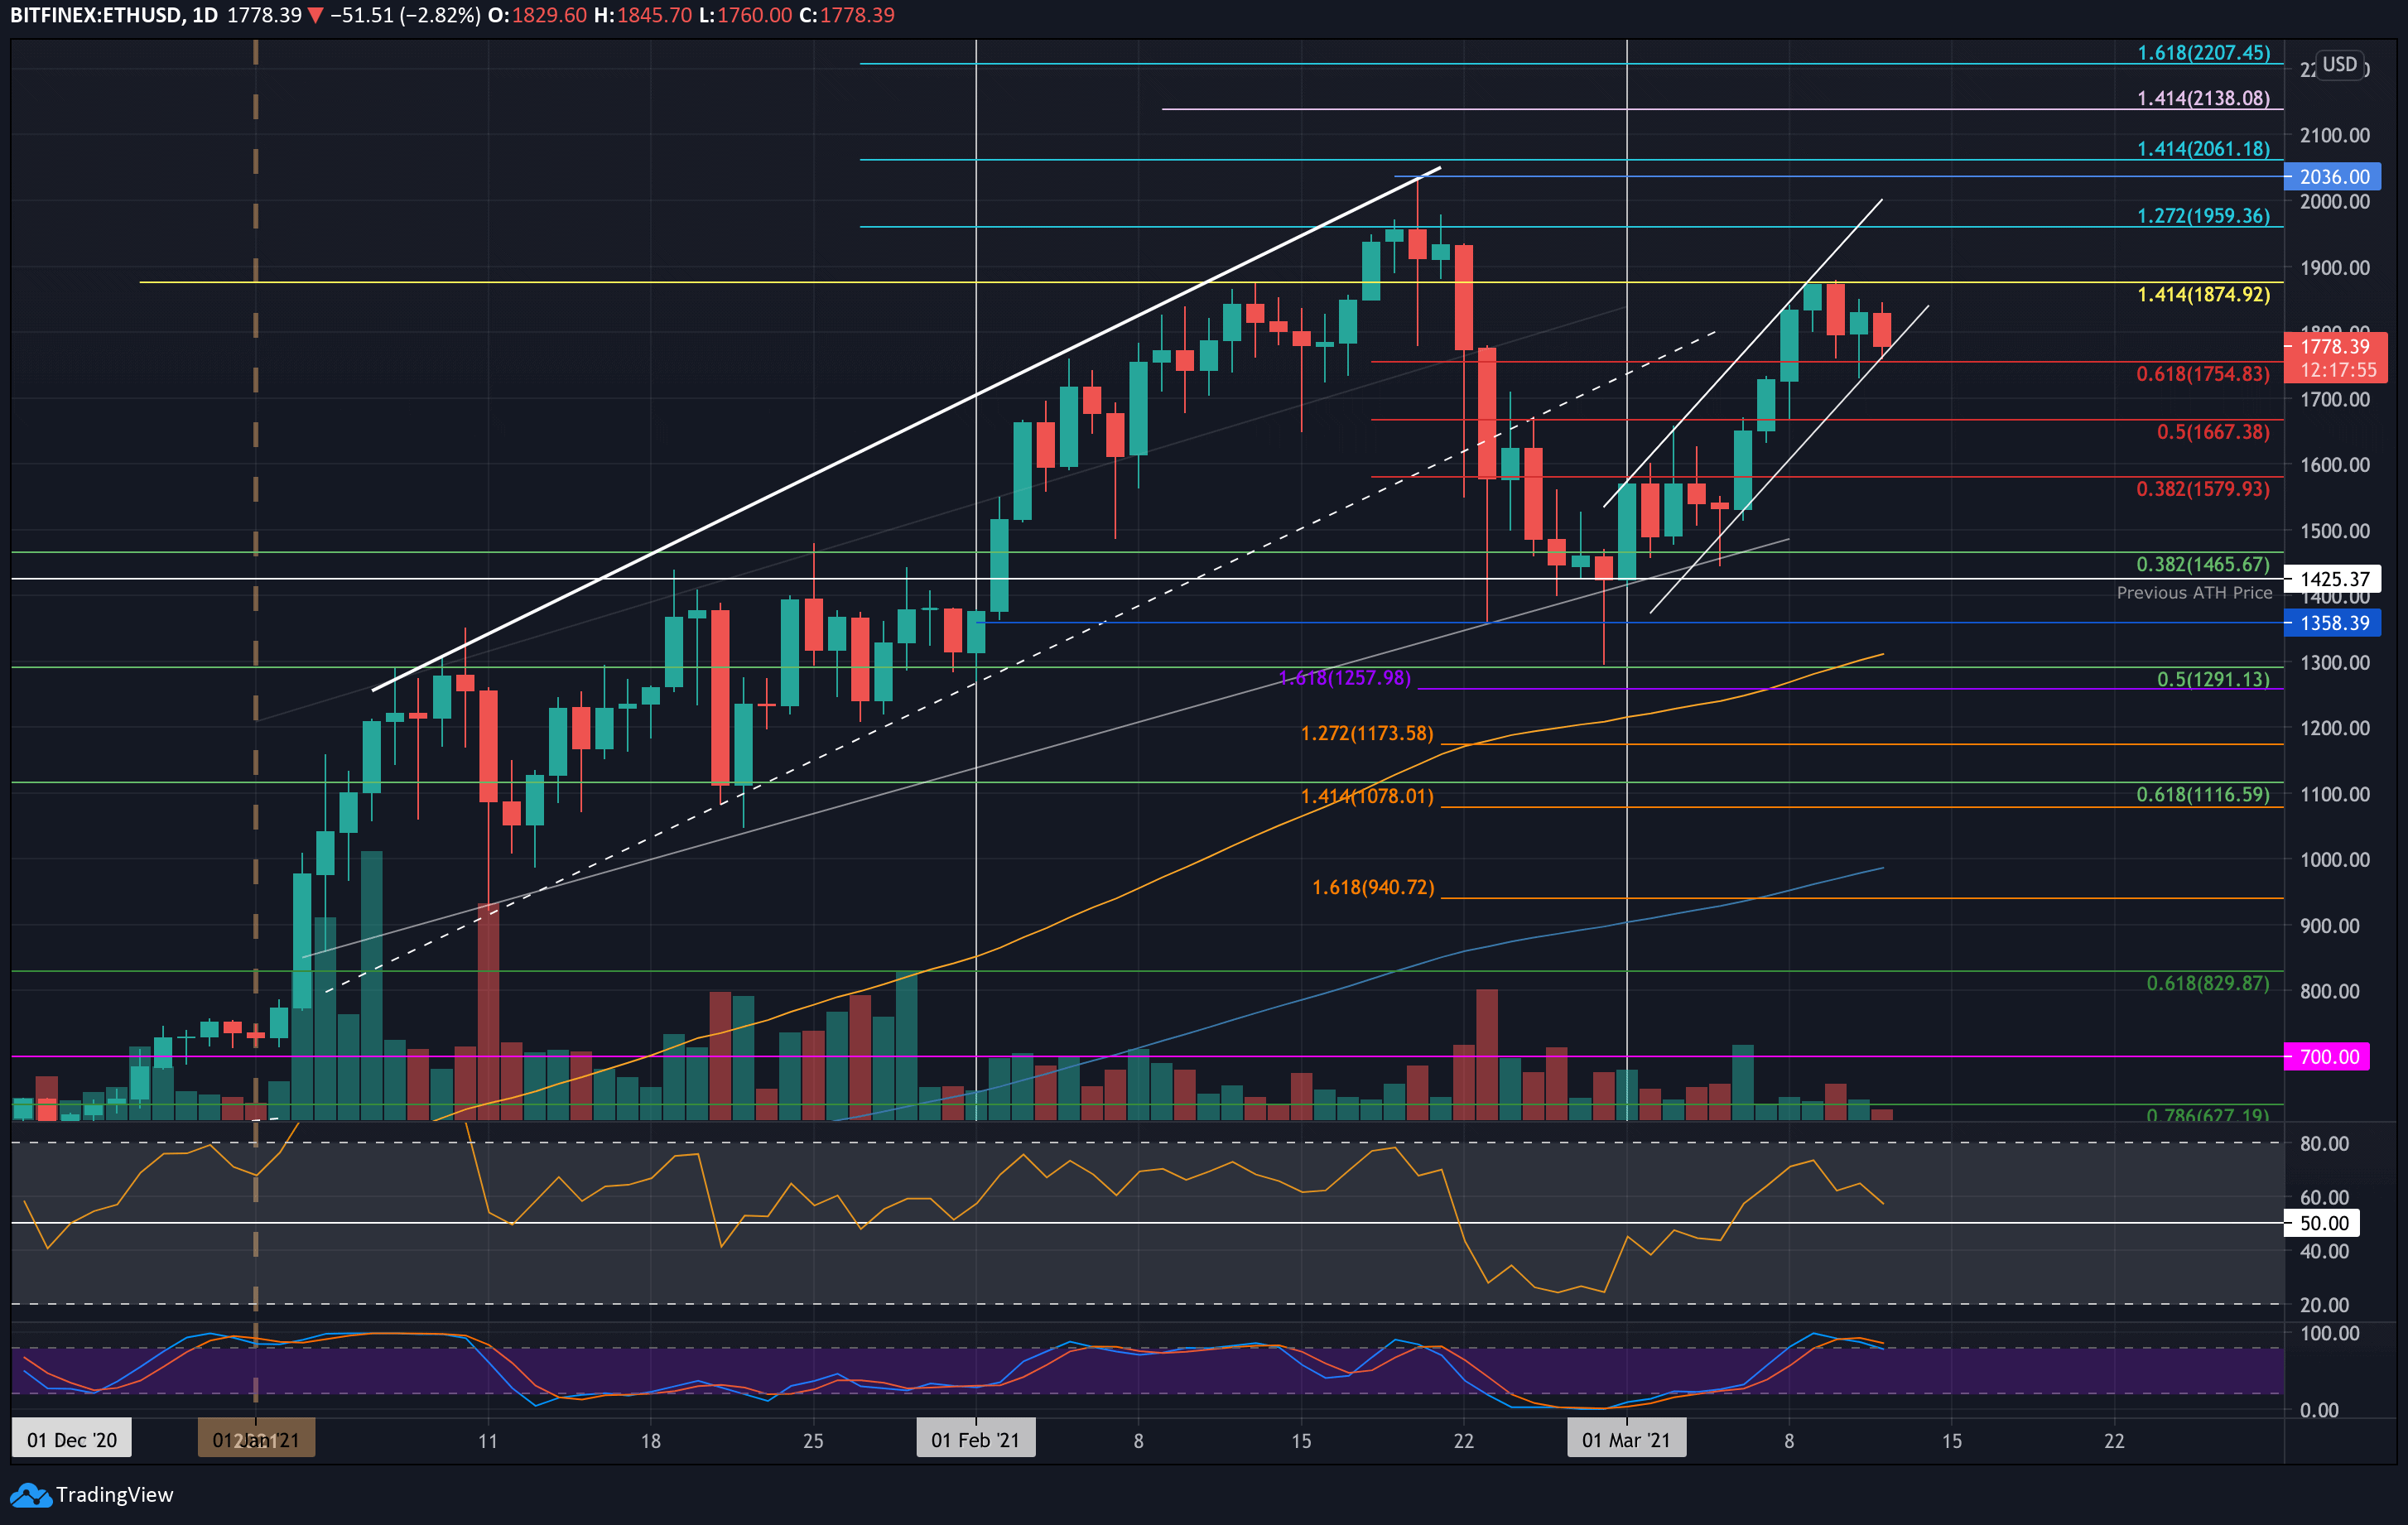
Ethereum started the week on a positive note after bouncing above $1500 over the weekend. It formed a short-term ascending price channel, reaching as high as $1875 (1.414 Fib Extension) before encountering resistance. Unable to close above this level, ETH rolled over on Wednesday, finding support at $1755 (previous resistance).
Currently, Ethereum is testing the lower boundary of the ascending price channel, and its next steps depend on how it reacts at this level.
Looking ahead, the immediate support is at $1755 (lower boundary of the price channel), followed by $1700, $1667 (previous resistance), $1580, and $1500. On the upside, the first major resistance is at $1876 (1.414 Fib Extension), followed by $1900, $1960 (1.272 Fib Extension), $2000, and the all-time high of $2036.
With the RSI heading lower, bullish momentum seems to be fading, although it is still above the midline, suggesting that the bears are not yet in full control.
Ethereum’s performance against Bitcoin has also faced setbacks this week. After initially pushing above the 100-day EMA at 0.0337 BTC and testing resistance at 0.035 BTC, ETH was unable to break through and reversed lower. By Wednesday, it had broken below both the 100-day and 200-day EMAs, and now trades at 0.0313 BTC.
Looking ahead, immediate support is found at 0.031 BTC (0.786 Fib), followed by 0.0305 BTC (0.886 Fib), 0.03 BTC, and 0.0295 BTC (downside 1.272 Fib Extension). On the resistance side, the first key level is at 0.0318 BTC (December 2020 highs), followed by 0.032 BTC (200-day EMA), 0.0337 BTC (100-day EMA), and 0.035 BTC (weekly high).
The RSI is in bearish territory, sinking below the midline, indicating that bearish momentum is building. A reversal would be necessary for the bulls to regain control of the market.