Ethereum has experienced a slight recovery today, bouncing back from its earlier decline to $1652 and climbing to $1732. This rebound marks a pivotal point in the ongoing market dynamics for ETH, as it continues to face both short-term challenges and opportunities for upward movement. Let’s take a closer look at the recent price action and potential future developments for Ethereum.
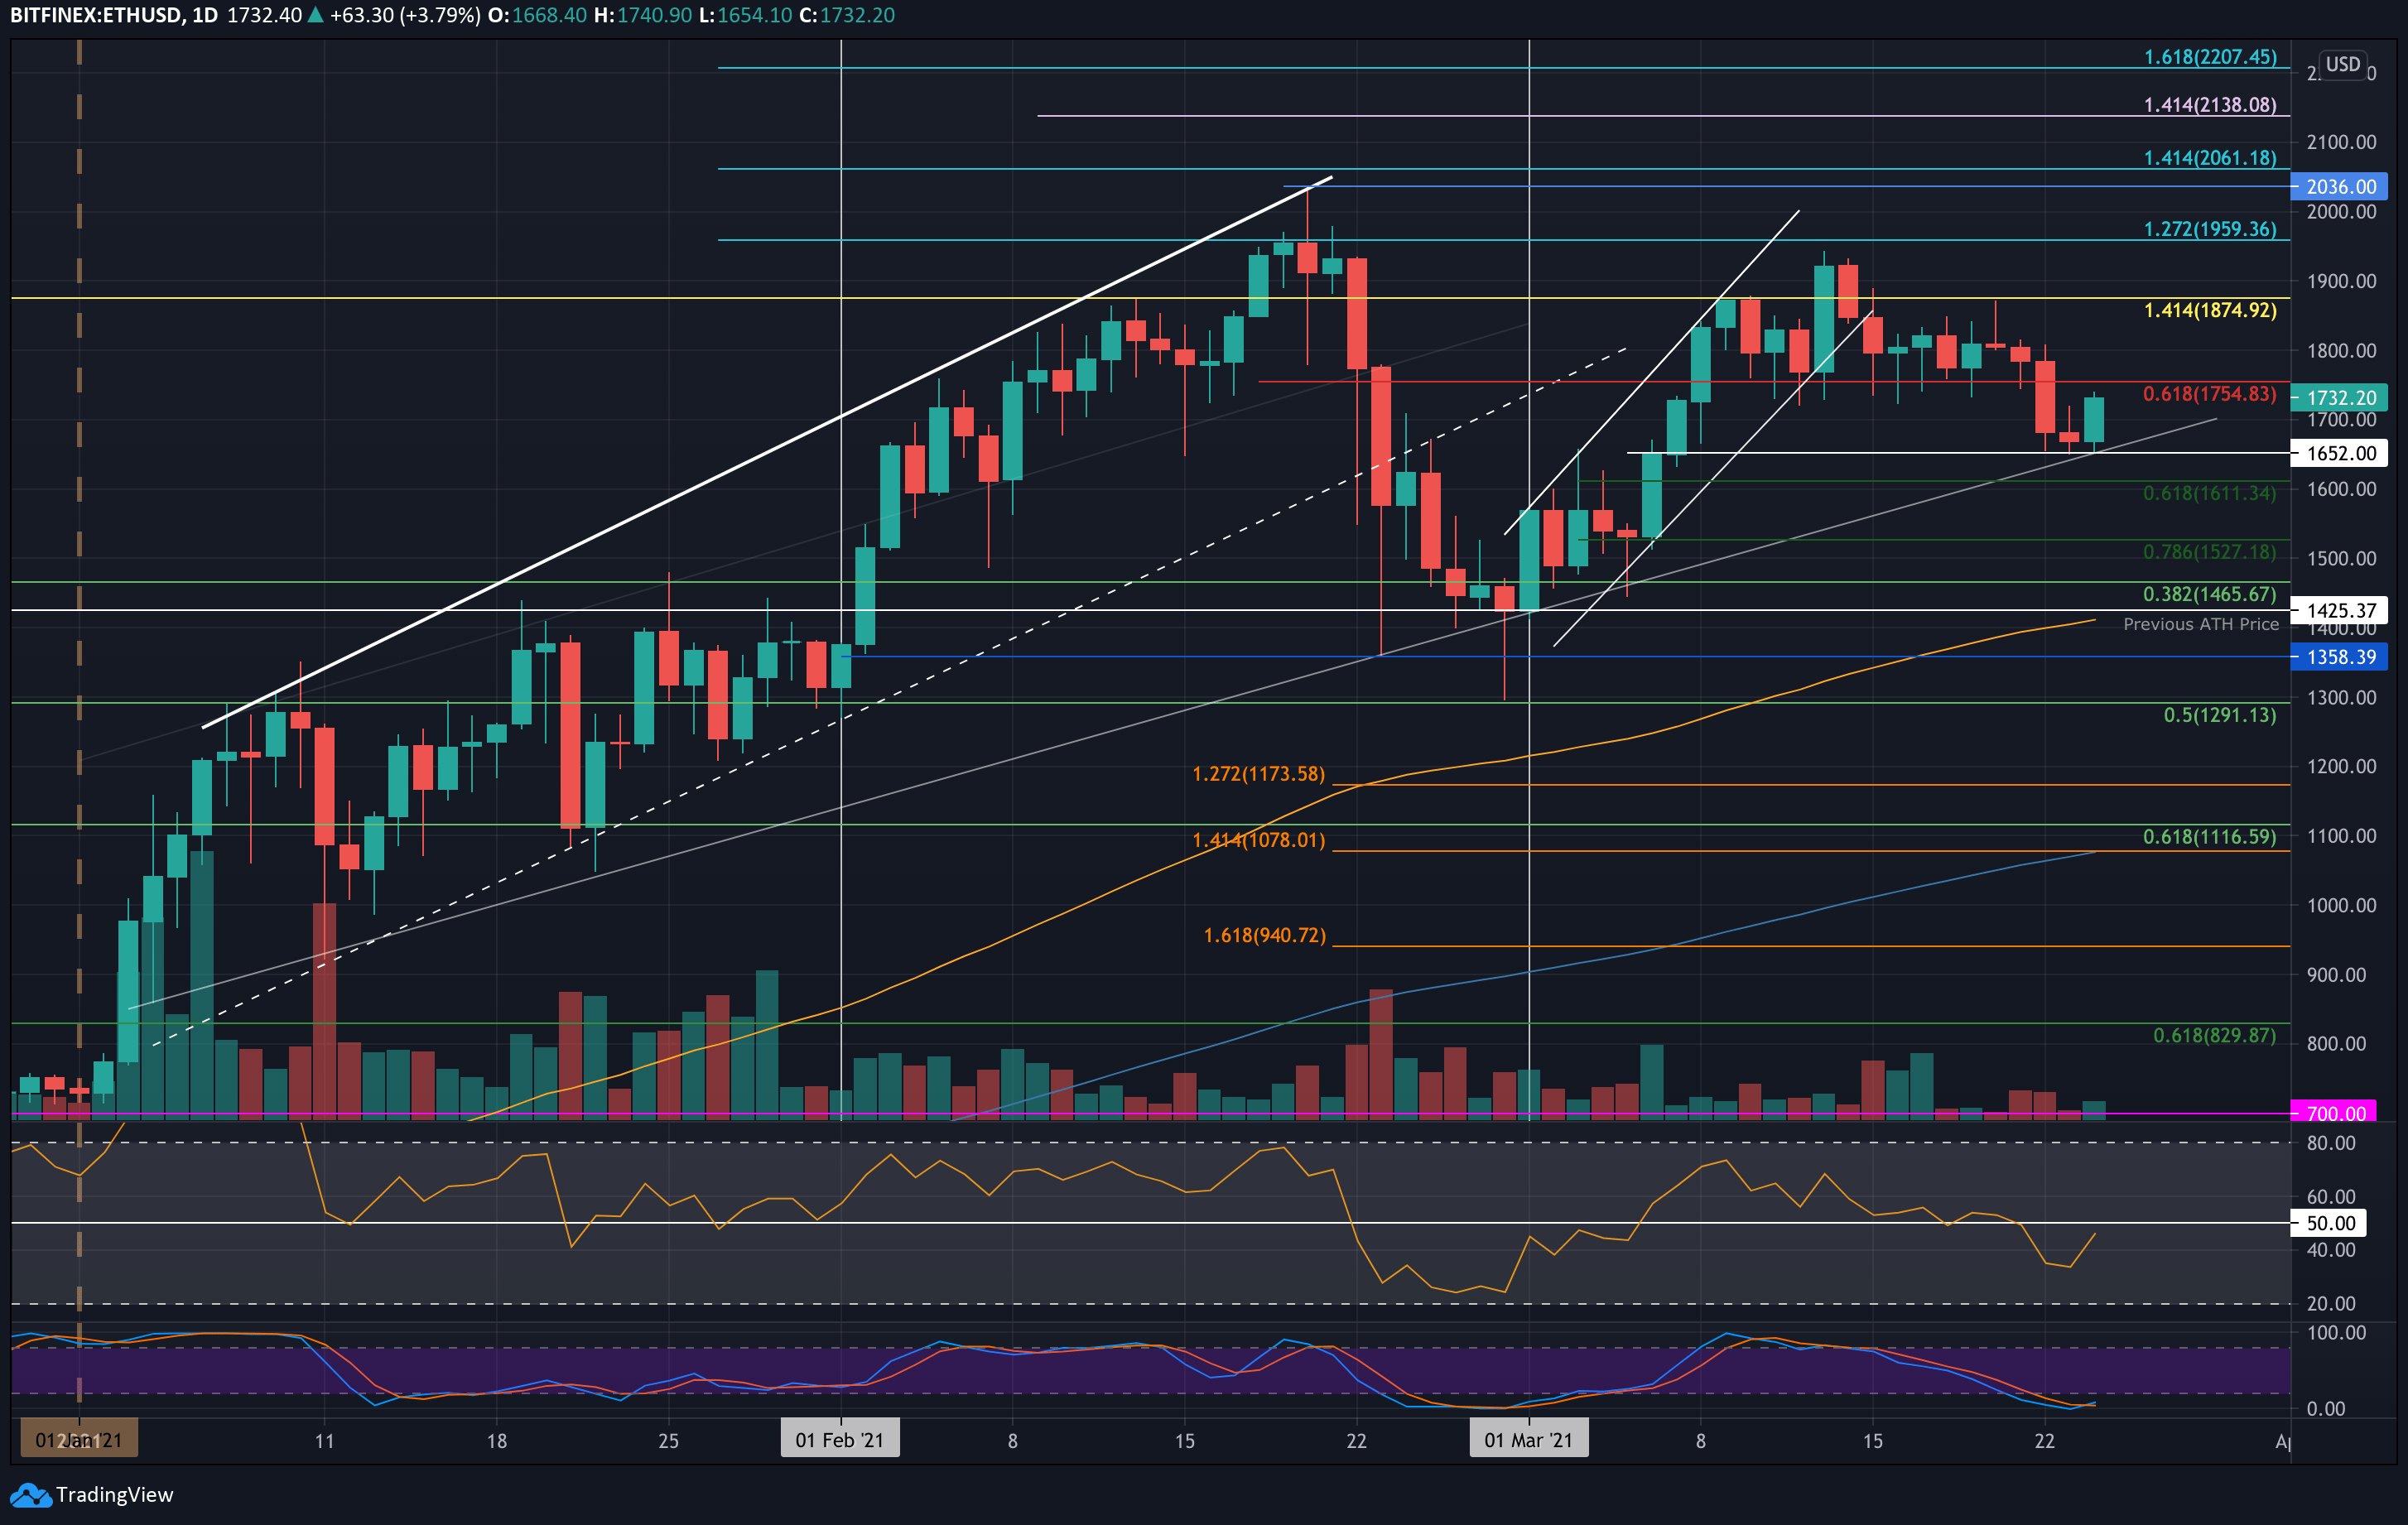
Ethereum has spent much of the past week within a trading range between $1875 and $1755. However, on Monday, ETH broke below the $1700 level, reaching as low as $1652. This price was supported by a key ascending trend line dating back to early January, which acted as a significant support level. After finding this support, Ethereum reversed direction and made its way back above $1700, reaching $1732 today.
- Support: The first key support is at $1652, followed by $1610, $1527, and $1425.
- Resistance: Ethereum faces immediate resistance at $1755, which coincides with a .618 Fib Retracement level. If it manages to break above this, the next resistance is seen at $1800, $1875, and potentially the all-time high closing price at $1960.
The Relative Strength Index (RSI) is showing signs of recovery, moving higher from below 40 toward the midline, suggesting that bearish momentum may be waning. Additionally, the Stochastic RSI is approaching a bullish crossover, which could indicate further upward movement for Ethereum in the near term.
Against Bitcoin, Ethereum has been showing some weakness, especially after it failed to maintain its support at 0.0305 BTC. Ethereum had previously held support at this level for most of the month, but today, it dipped slightly below it, reaching 0.0302 BTC. Although ETH has since recovered above the 0.0305 BTC mark, this brief drop highlights the increasing pressure on Ethereum relative to Bitcoin.
- Support: Ethereum’s immediate support is at 0.0305 BTC, followed by 0.03 BTC, 0.0295 BTC, and 0.0285 BTC (February highs).
- Resistance: On the upside, resistance is at 0.031 BTC, 0.0318 BTC, 0.032 BTC (200-day EMA), and 0.0337 BTC (November 2020 highs).
The RSI in the ETH/BTC pair is currently in bearish territory and has started to head lower, signaling that Ethereum’s price may face further downward pressure against Bitcoin. A break below 0.03 BTC could lead to a steeper decline toward 0.028 BTC.
In the short term, Ethereum’s price could see a continuation of the recent rebound if it can break through resistance levels, particularly at $1755. A successful breach of this level may pave the way for higher targets, including $1800 and $1875. On the other hand, should Ethereum fail to maintain support at $1652, it could retest lower levels, such as $1610 or $1527.
Against Bitcoin, Ethereum is currently facing more resistance. The key to maintaining its relative strength lies in holding the 0.0305 BTC support. If Ethereum slips below this level and breaks 0.03 BTC, it could face a more prolonged downturn against Bitcoin.
Ethereum is at a critical juncture in both USD and BTC pairs. While the short-term outlook for ETH/USD shows some promising signs of a recovery, Ethereum’s relative strength against Bitcoin needs to improve to avoid further weakness. Traders should monitor the key support and resistance levels closely, as they will dictate the next move for ETH in the coming days.


