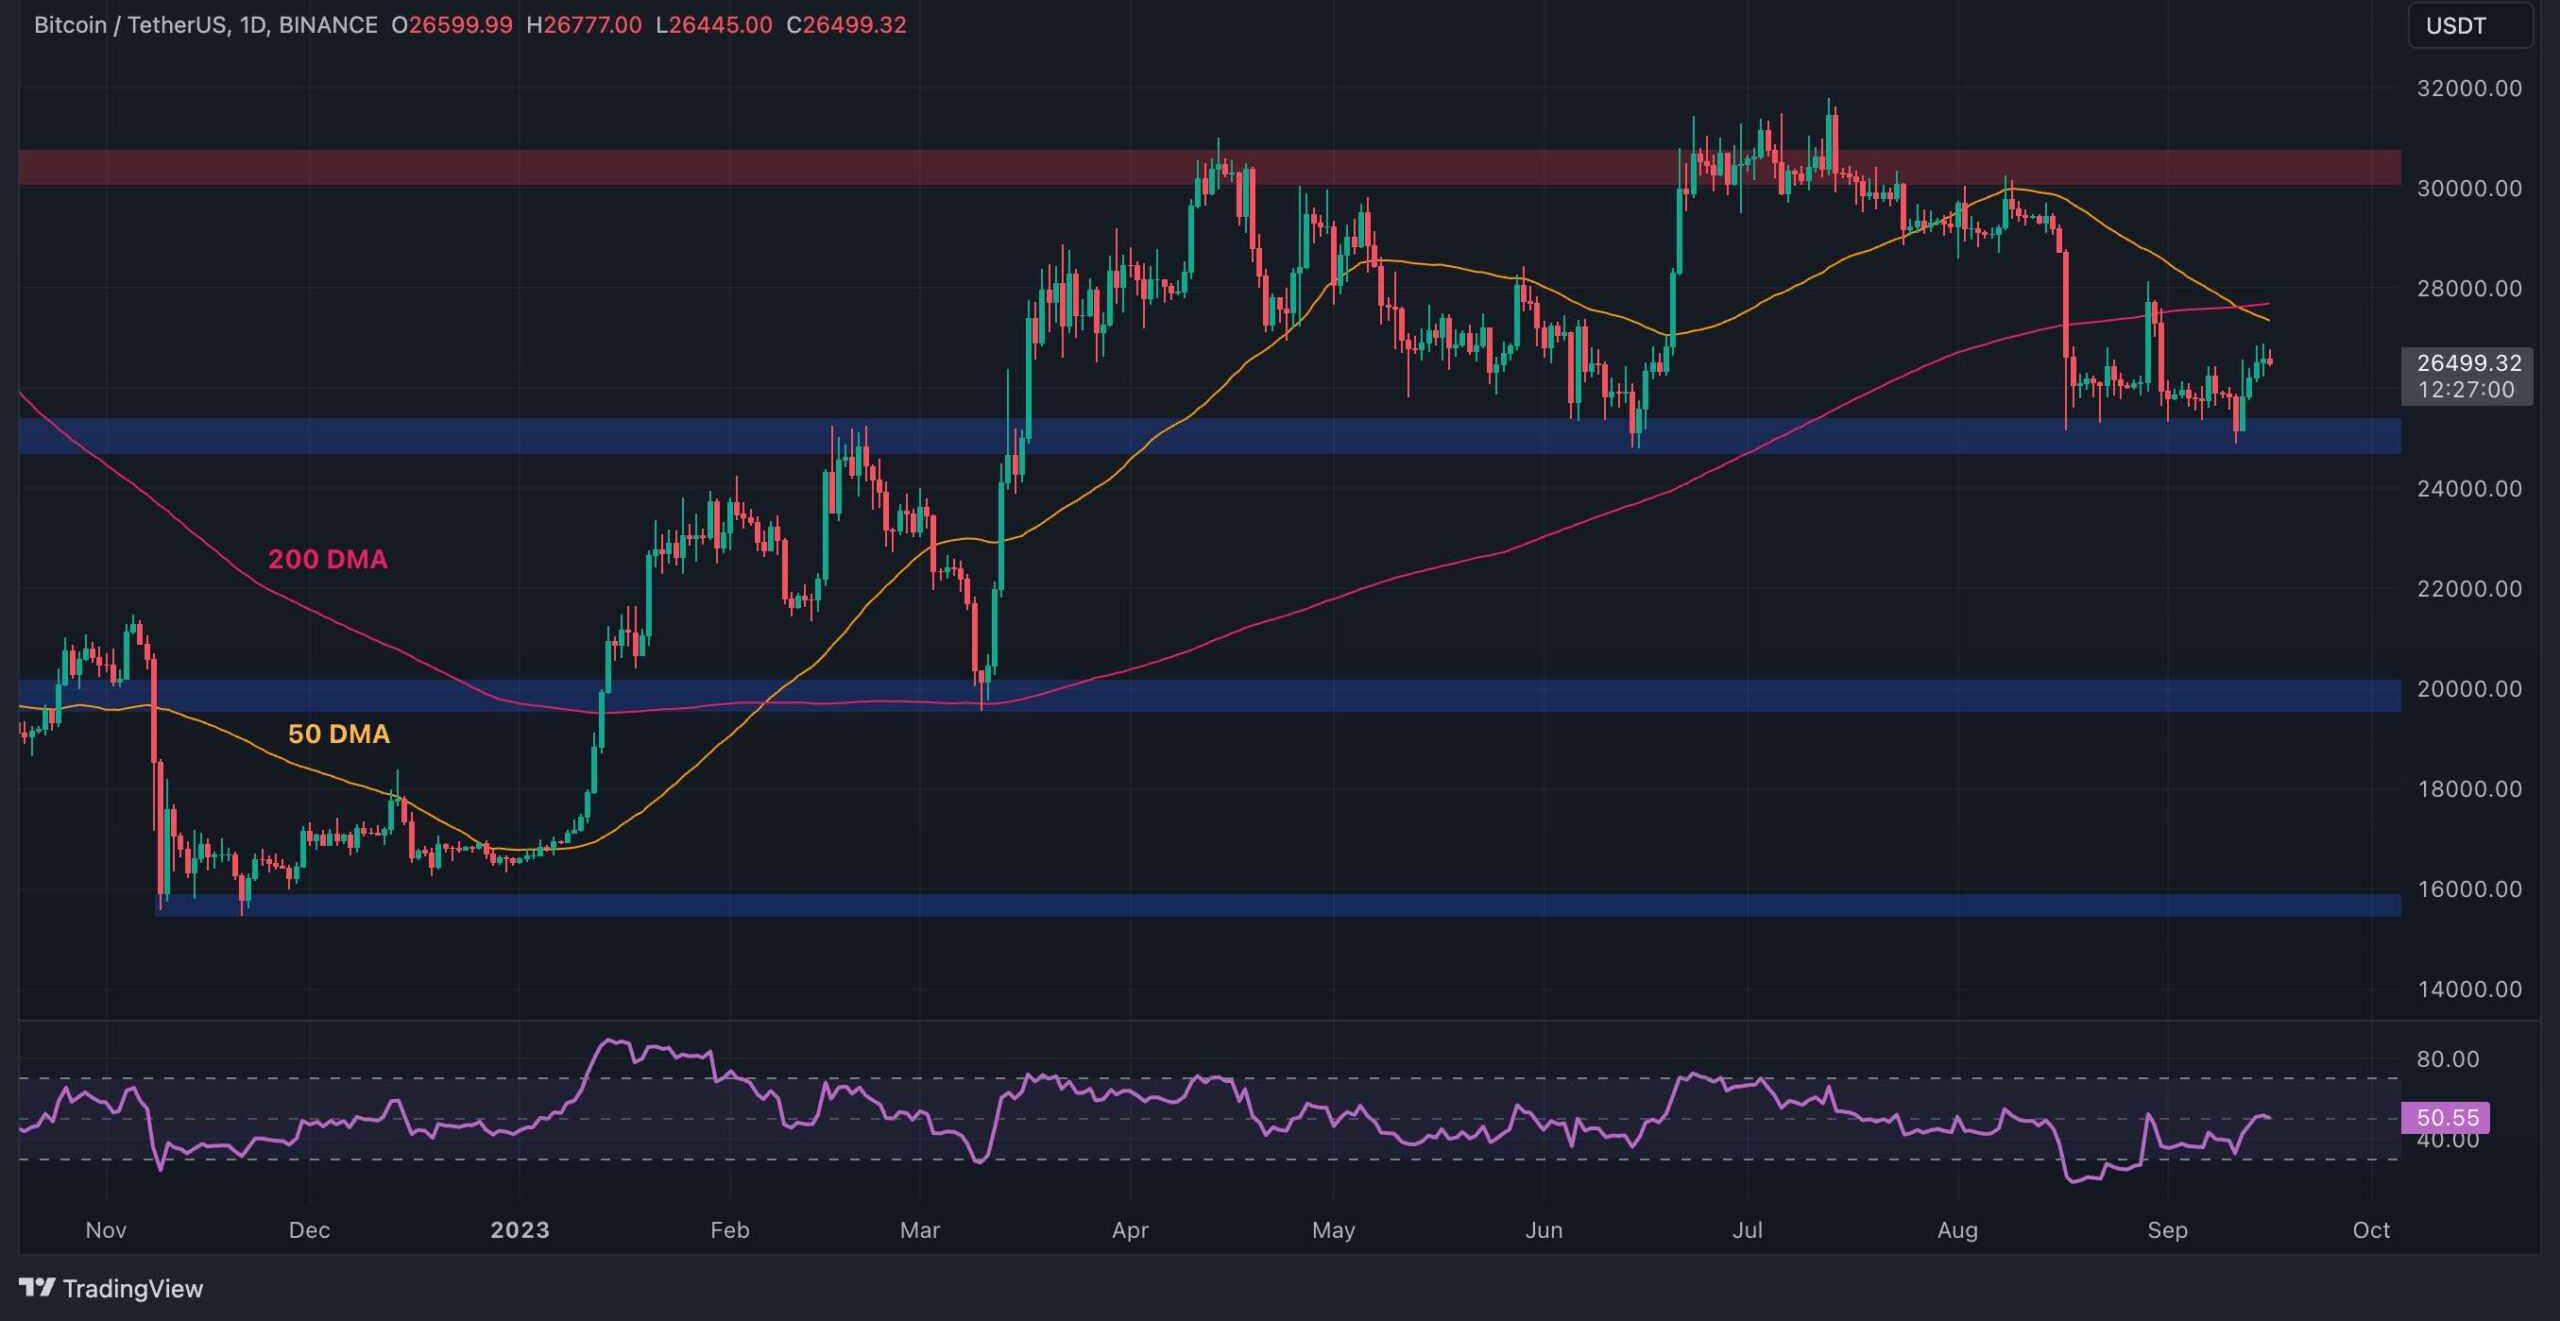
On the daily chart, Bitcoin has been rejected at the $25K support level and is trending upward. However, the 50-day and 200-day moving averages, positioned around the $28K mark, represent significant resistance levels. For a retest and potential breakout above $30K, the price must surpass these resistance zones. The Relative Strength Index (RSI) has risen above 50%, indicating that momentum is shifting back in favor of the buyers.
The 4-Hour Chart
The 4-hour timeframe presents a clearer picture of Bitcoin’s price action. The market is currently testing the upper boundary of a large falling wedge pattern. A successful breakout above this pattern could lead to a rally toward the $30K resistance level, as this pattern is typically a bullish reversal signal. The recent bullish divergence in the RSI further supports the possibility of a rise toward the $30K zone in the short term.
Short-Term Holder SOPR
Bitcoin’s price rejection from $30K and subsequent decline have impacted investors, particularly short-term holders. The Short-Term Holder Spent Output Ratio (STH SOPR) metric, which indicates whether short-term holders are selling at a profit or a loss, has been trending below 1 over the past few weeks. This suggests that short-term holders are realizing losses by selling their coins below their purchase price, likely due to fear of further declines. While capitulation in an uptrend often indicates the transfer of coins from weak hands to stronger hands, the market is not yet in a bullish phase. If this behavior persists, excess supply from these sales could push the price lower.