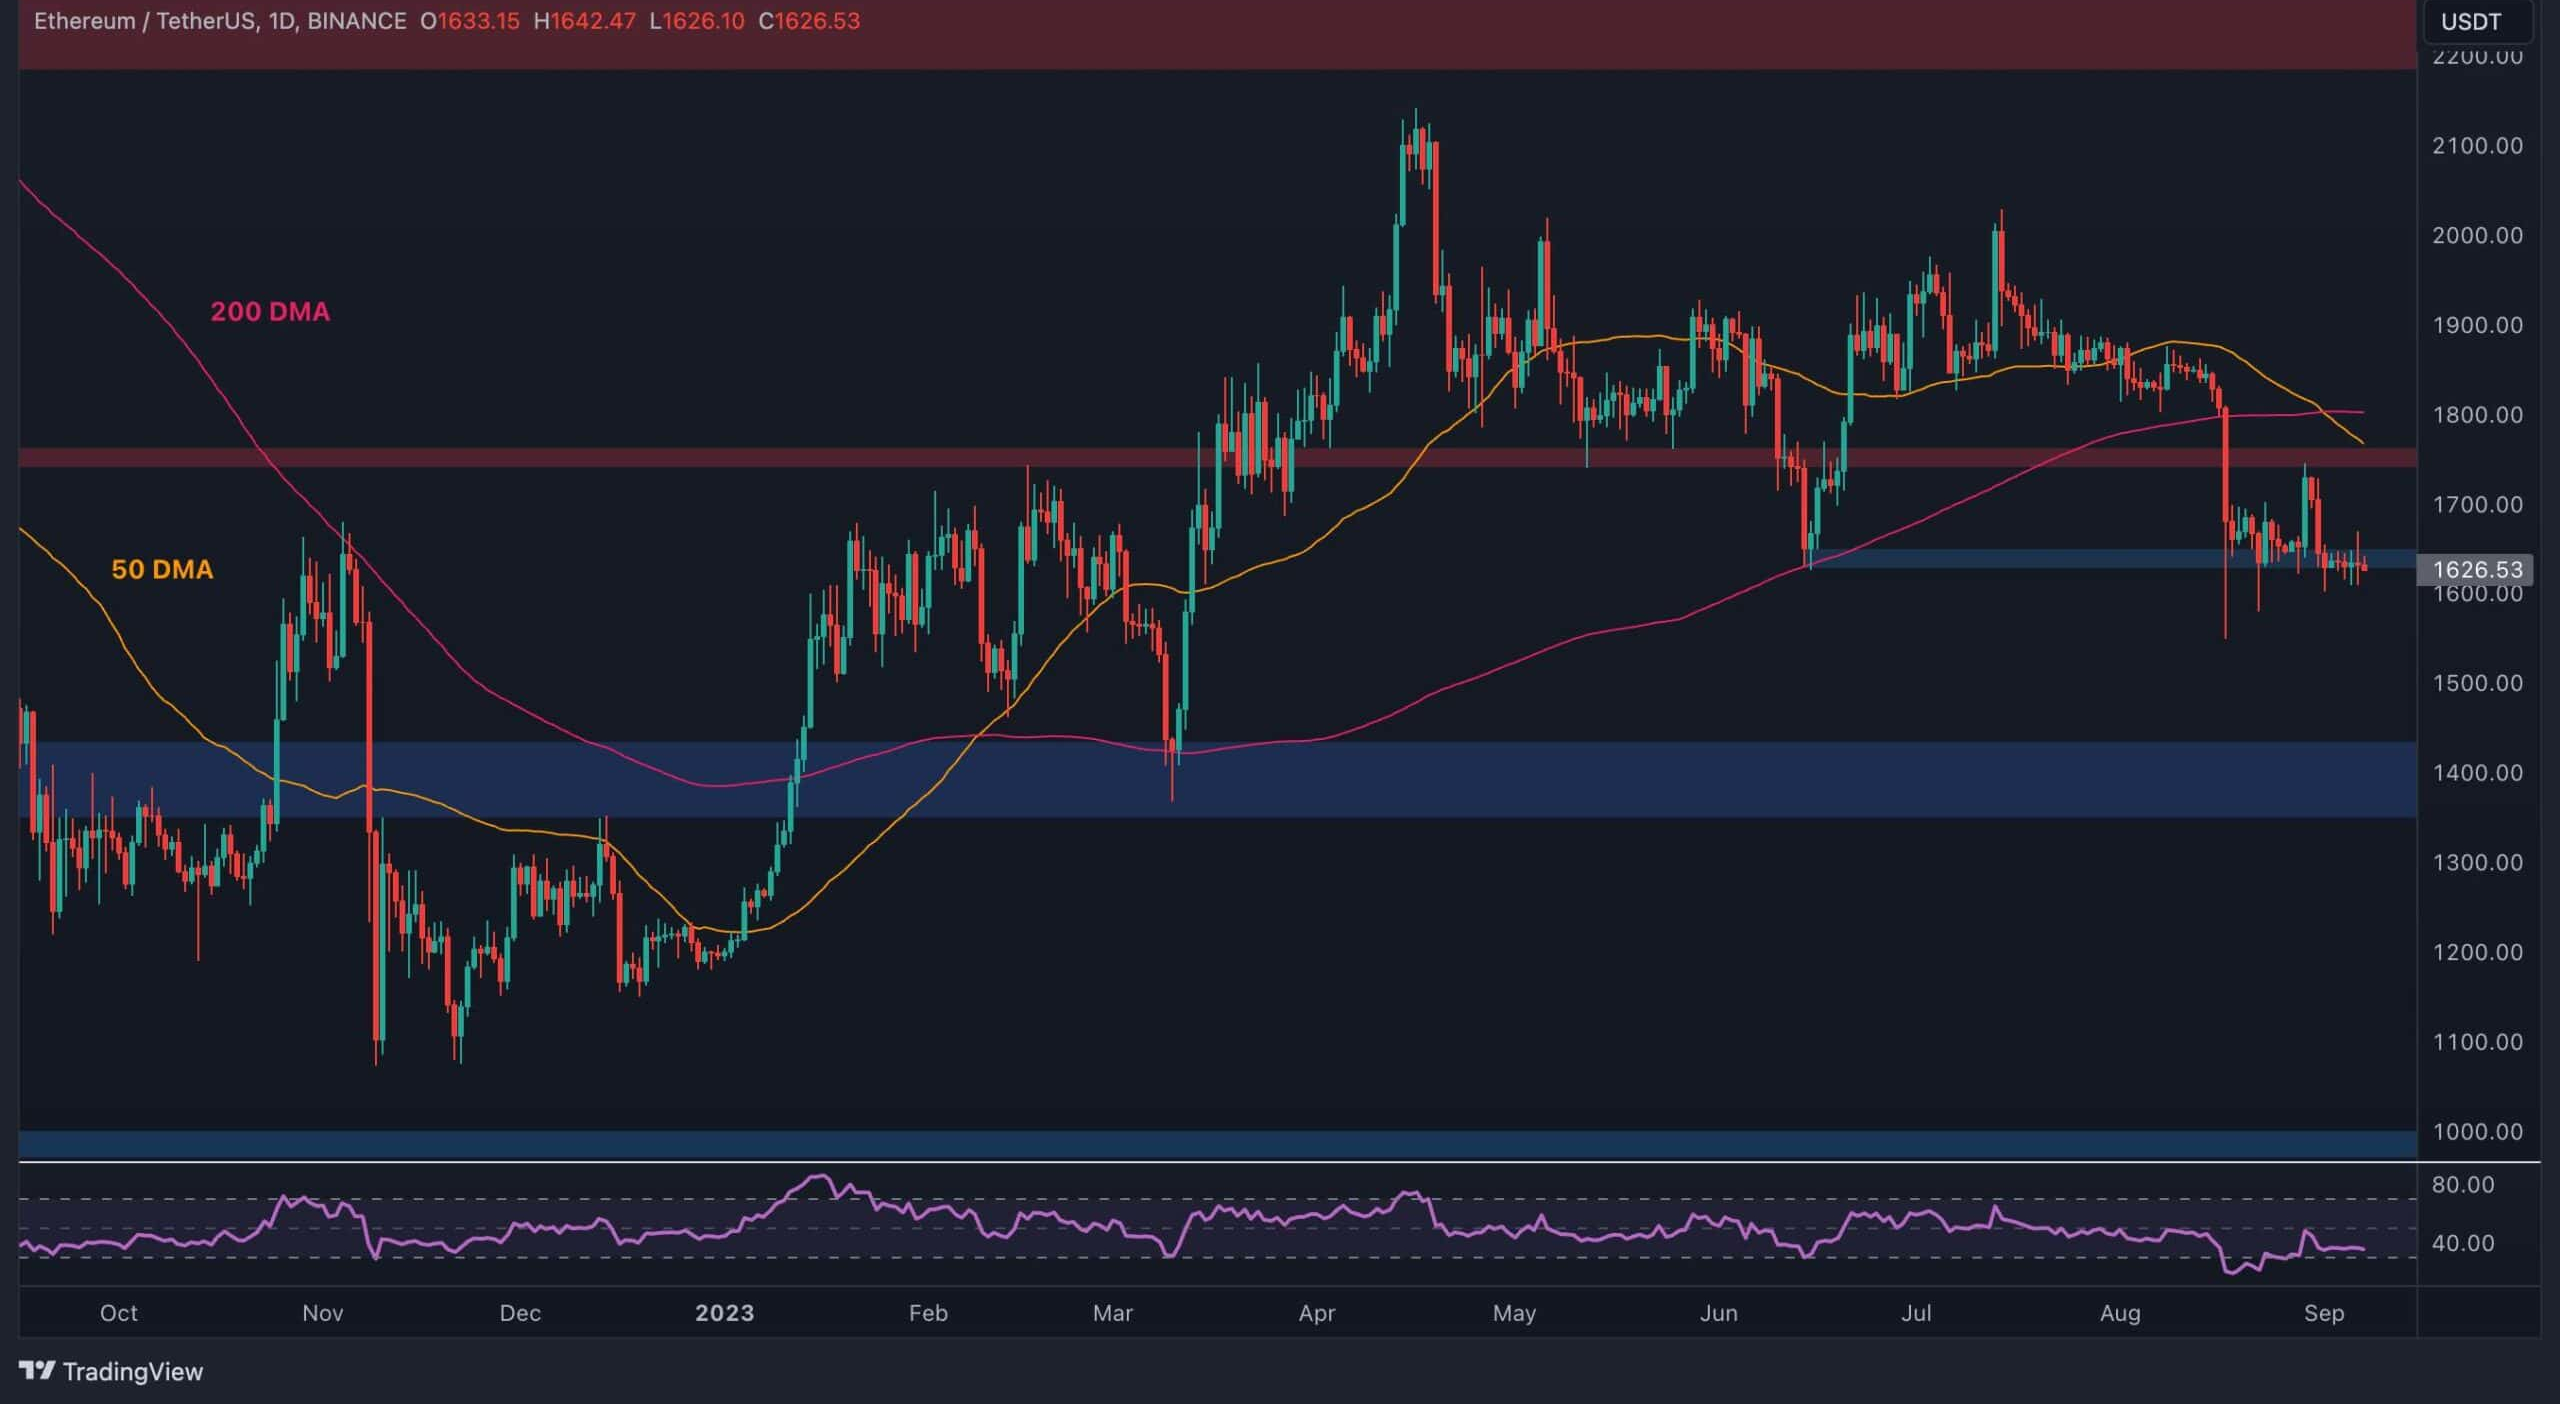
On the daily chart, Ethereum has been holding steady around the $1,650 support level after facing a decisive rejection from $1,750. Given the current market structure and price behavior, the likelihood of a deeper decline toward the $1,400 level appears greater than a potential rebound toward the $2,000 zone. The recent bearish crossover between the 50-day and 200-day moving averages further strengthens the possibility of a continued downturn, signaling that a deeper drop may be imminent.
The 4-Hour Chart
On the 4-hour chart, the bearish momentum is more pronounced, with the price struggling to maintain the $1,650 support level. A breakdown below this level seems likely, considering the persistent pressure from sellers. Additionally, the Relative Strength Index (RSI) remains below 50%, confirming the bearish momentum. The price could attempt a reversal if the $1,650 level holds and pushes Ethereum back above the $1,750 resistance zone, but for now, the outlook remains negative.
Ethereum Funding Rates
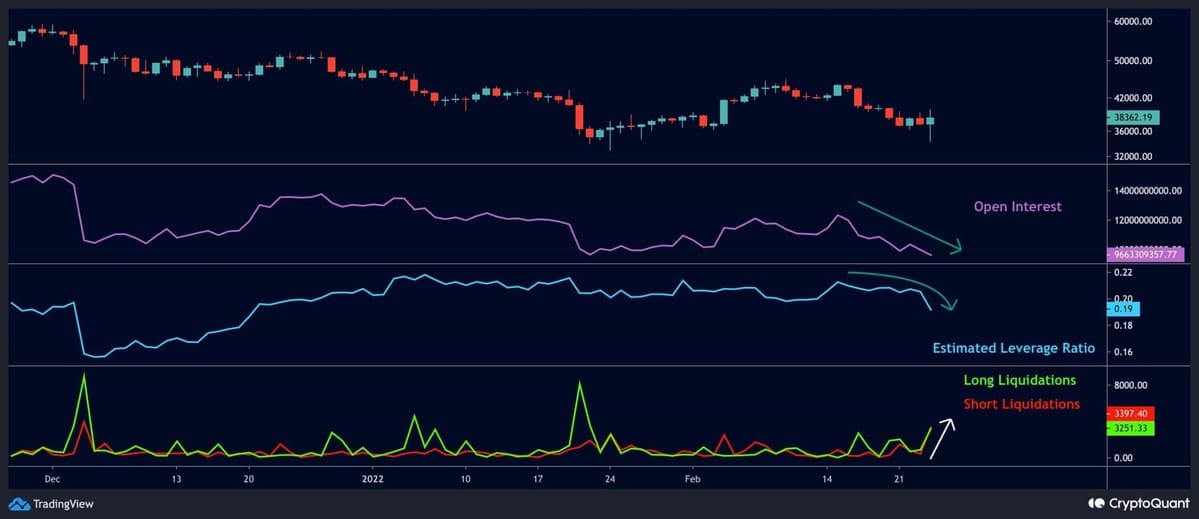
Despite Ethereum’s bearish price action over the past few weeks, the futures market shows some interesting data. The Ethereum funding rates, which reflect the difference between perpetual contracts and spot prices, remain positive. This suggests that futures traders are still hopeful about a potential rally in the near future, anticipating an upward price movement. However, positive funding rates can lead to long liquidations if the price continues to decline, potentially triggering a cascade of sell-offs that could push the price lower.