XRP saw a modest 1.6% price increase today, though it remains constrained by the 200-day EMA resistance. Following a drop beneath the symmetrical triangle pattern at the end of October, XRP has continued to face downward pressure.
Against Bitcoin, XRP is currently trading near its 3-year lows.
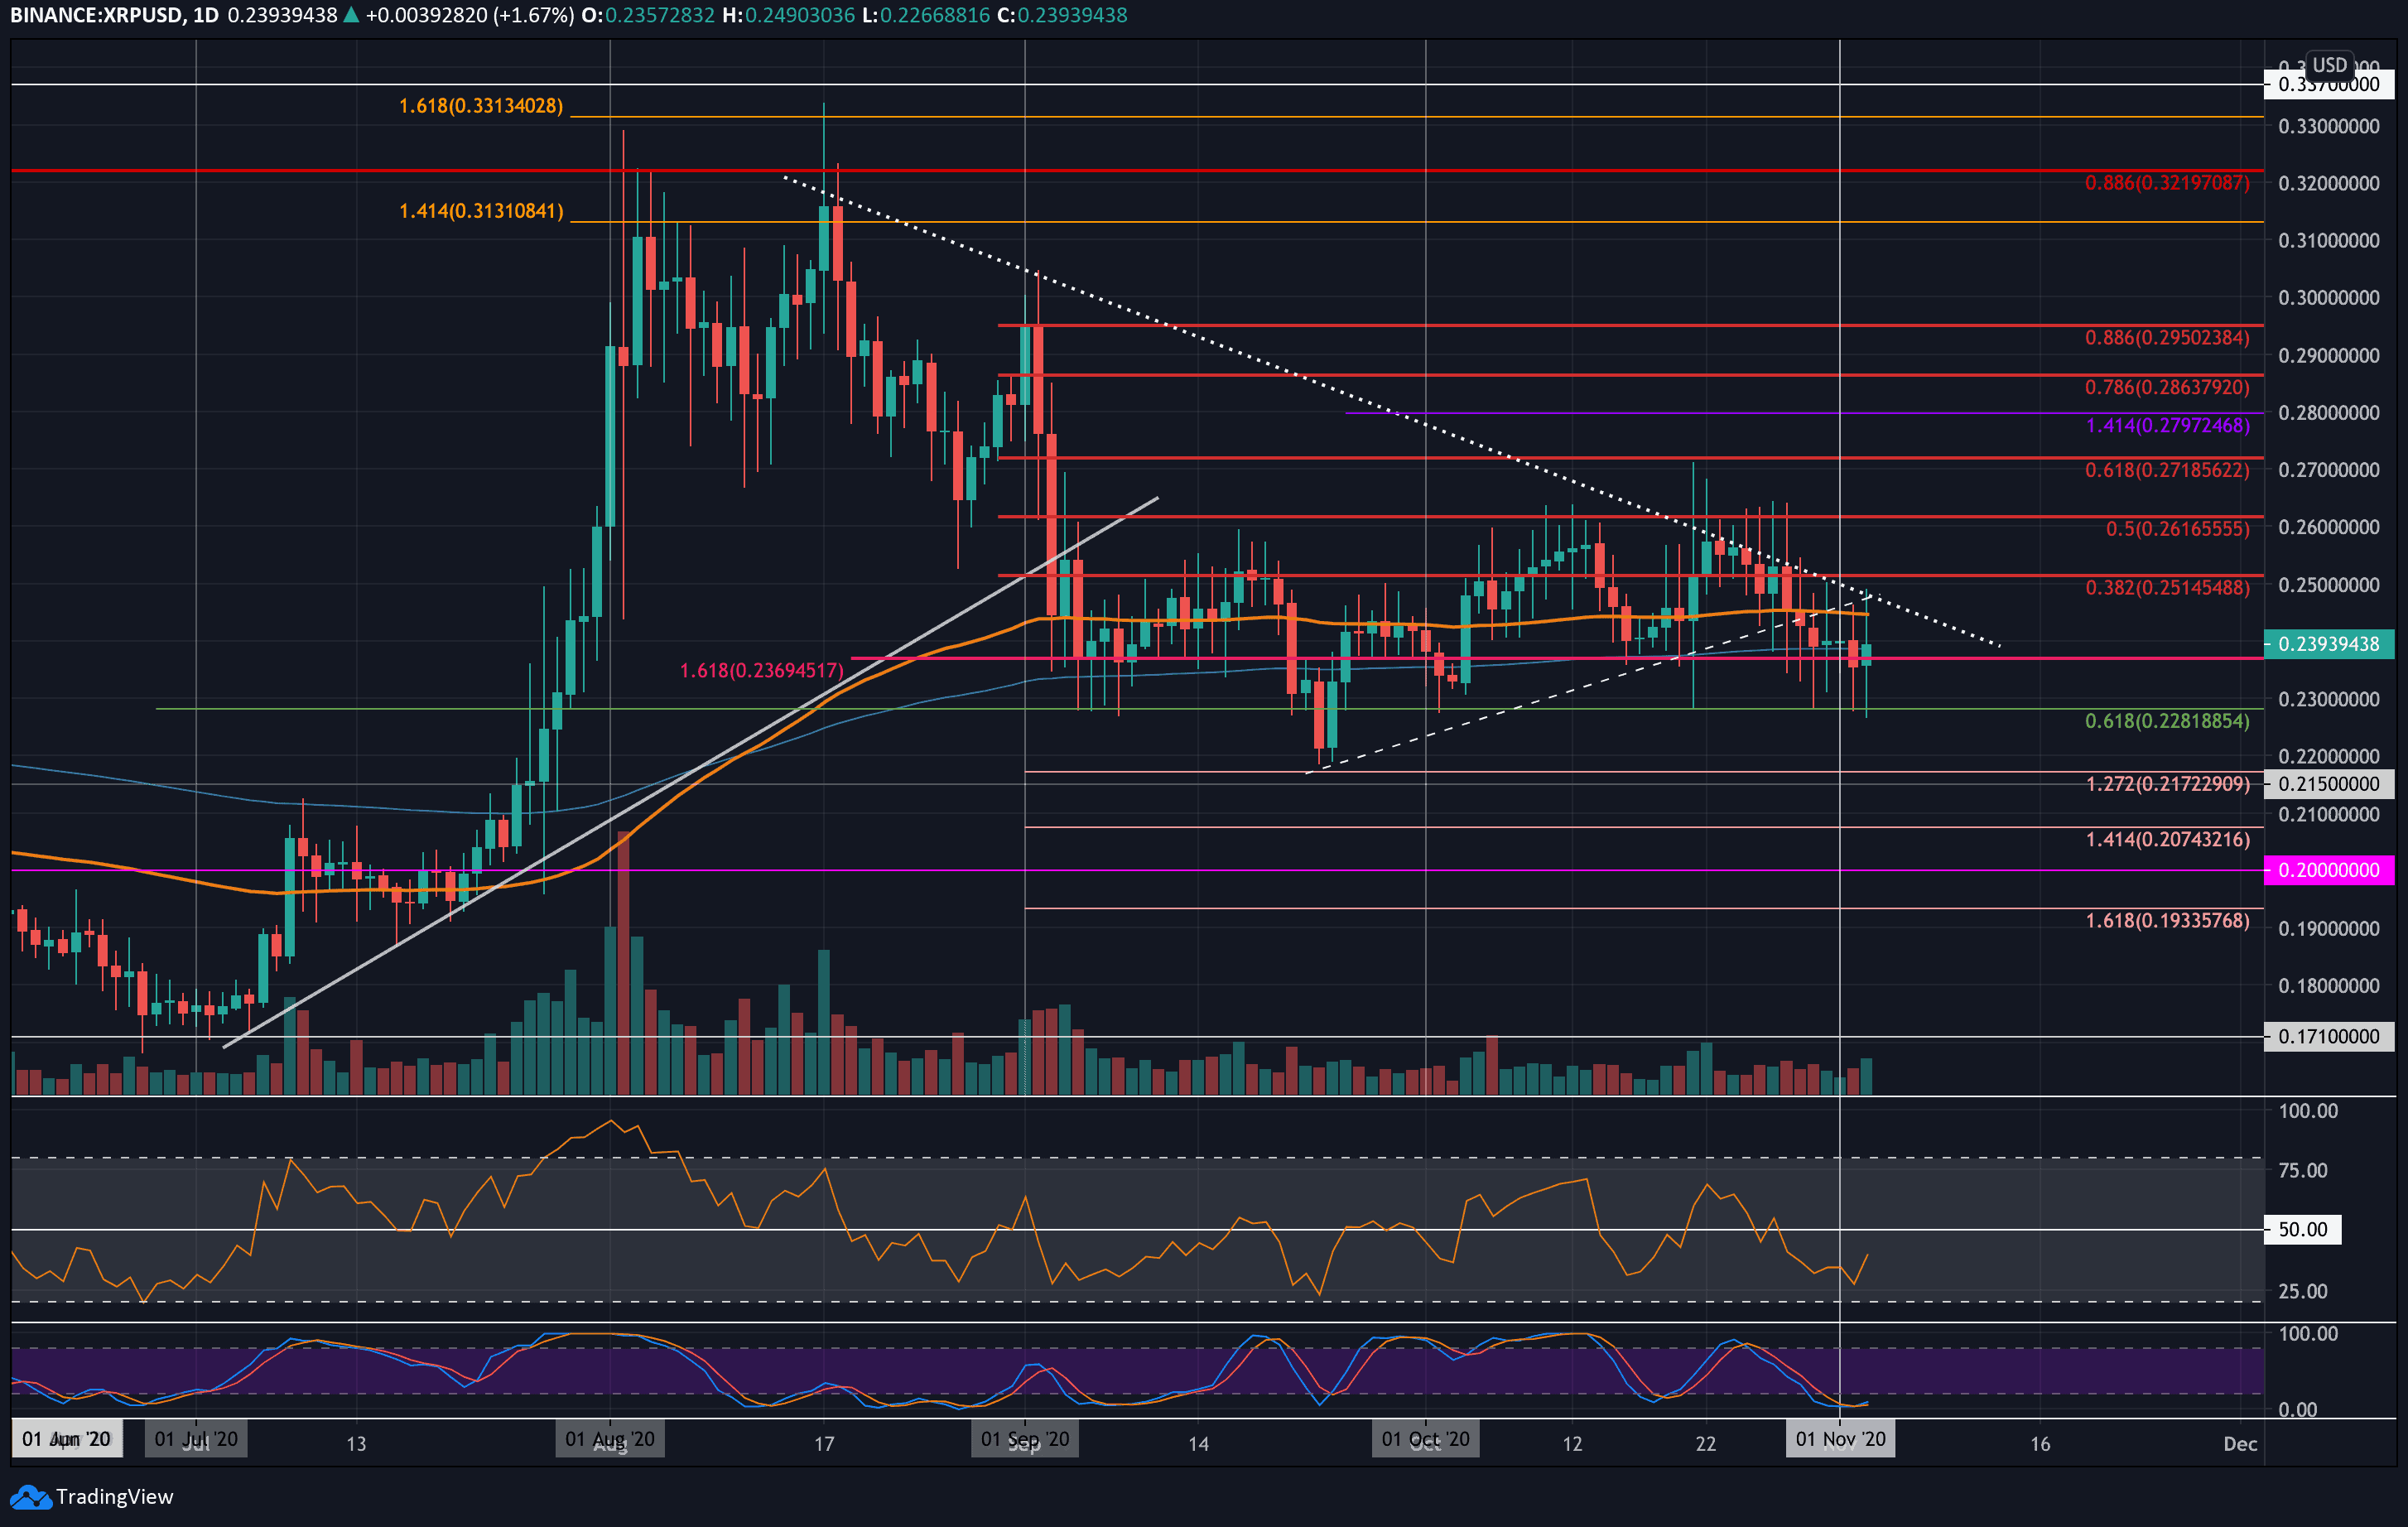
XRP dropped beneath the symmetrical triangle pattern at the end of October and headed toward the 100-day EMA. Support was found at the 200-day EMA, but the coin fell below it yesterday. Despite this, XRP has remained supported at $0.228, which is also the .618 Fibonacci level and the October lows.
A break below this level could potentially send XRP into a downward spiral toward the $0.20 range. Conversely, for the coin to turn bullish, it would need to break through resistance at $0.26.
Looking ahead, if the sellers push XRP beneath the $0.235 level, the first support is at $0.228, the .618 Fibonacci level. Below that, further support can be found at $0.22, $0.215, and $0.21.
On the other hand, if buyers manage to push XRP back above the 200-day EMA, the first resistance level lies at the 100-day EMA and the falling trend line. Beyond that, resistance is seen at $0.251 (bearish .382 Fibonacci) and $0.261 (bearish .5 Fibonacci).
The Stochastic RSI is in extremely oversold territory, indicating a potential bullish crossover that could drive prices higher. Additionally, the RSI recently rebounded from oversold conditions, signaling that the bearish momentum may be stalling.
XRP has been under significant pressure against Bitcoin, having fallen by 28% in October from a high of 2400 SAT to a low of 1725 SAT, aligning with the 1.618 Fibonacci Extension. Despite this, bulls have defended the 1725 SAT support level over the past four days. However, the downward momentum remains strong.
A break back above 1900 SAT (July 2020 lows) would be a promising signal for bulls. On the other hand, a daily candle closing below 1725 SAT would likely lead to further downside.
Looking ahead, if bulls push higher, the first resistance lies at 1800 SAT. Above that, resistance levels can be found at 1865 SAT, 1900 SAT, and 2000 SAT (bearish .382 Fibonacci Retracement).
On the downside, if sellers break beneath the 1725 SAT support, additional support is located at 1700 SAT, 1683 SAT (downside 1.272 Fibonacci Extension), 1650 SAT (downside 1.414 Fibonacci Extension), and 1600 SAT.
Both the RSI and Stochastic RSI are extremely oversold, which suggests that the downward pressure may be nearing an end, providing potential for a reversal.
XRP continues to battle significant resistance levels on both USD and BTC pairs. Key support levels are being defended, but a break below these levels could result in further downside. Conversely, if buyers manage to push the price above critical resistance zones, a bullish trend could emerge. Given the oversold conditions on both RSI and Stochastic RSI, XRP may be poised for a potential reversal if it can regain momentum.


