Bitcoin’s price continues its bullish run, reaching a new high for 2020. After wicking up to $13,500, Bitcoin has set a fresh milestone, but crucial levels need to be maintained for the upward trend to continue.
Currently, Bitcoin bulls are attempting another breakout as prices surge above the 0.618 Fibonacci level around $13,360 for the second time in 48 hours. The price briefly spiked to $13,500, marking the highest point of the year. However, this is a pivotal moment for Bitcoin. If the price fails to maintain momentum above this level, a bearish double top could form, potentially leading to a sharp price drop.
As for the overall cryptocurrency market, the global market capitalization has bounced back to $397 billion, after a $12 billion drop yesterday. To confirm that a new bullish phase has begun, a new high above the $400 billion threshold would be ideal.
Key Levels to Watch in the Short Term
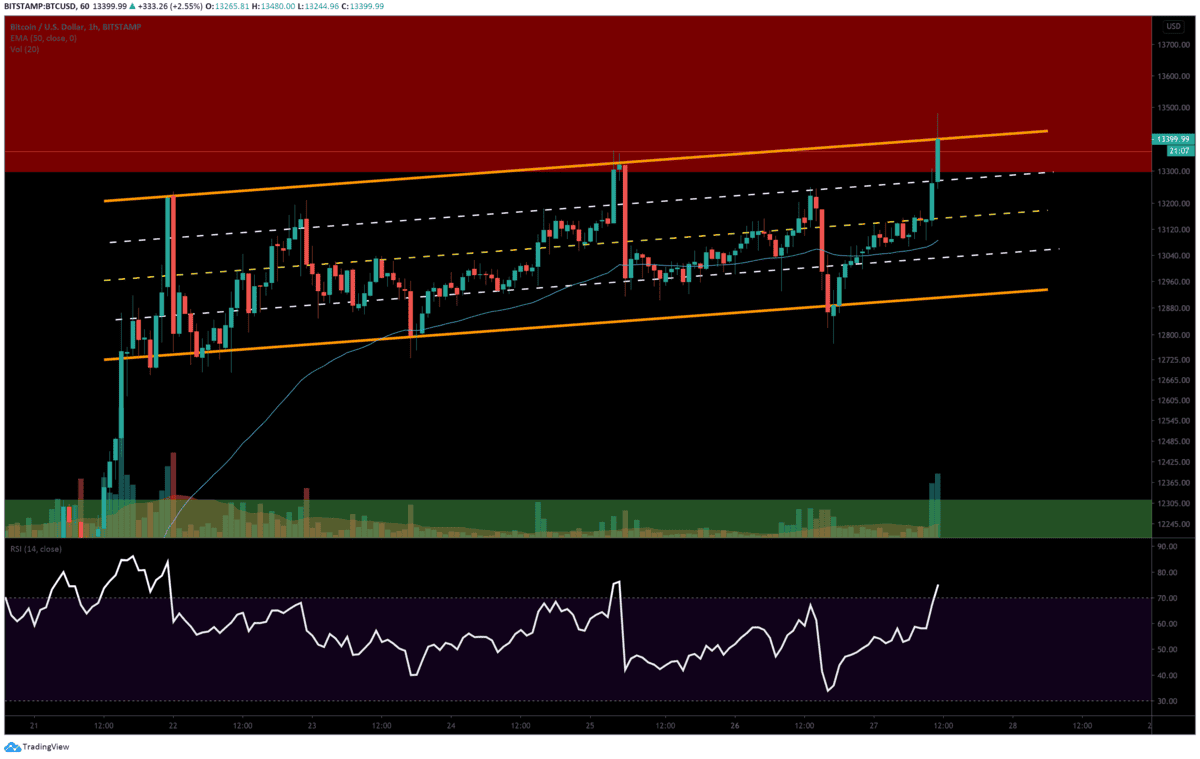
On the 1-hour BTC/USD chart, Bitcoin’s price action is forming a bullish flag pattern, with the price fluctuating between two up-trending trendlines. Prices are responding strongly to median lines, indicating that these levels are important support and resistance points.
Bitcoin has recently broken through the main resistance of this flag pattern, which is a positive sign for further upside movement. If Bitcoin can hold above this level, the next targets will likely be the $13,880 and $14,000 levels.
However, Bitcoin is facing strong selling pressure in this region, with bears attempting to push prices back down. The $13,400 level is critical for today’s intraday session. If bears manage to defend this level, a downturn could occur, pushing Bitcoin towards lower levels such as $13,300, $13,150, $13,000, and $12,915. Additionally, the 1-hour 50 EMA at $13,080 could also provide support if the price dips further.
On the 4-hour BTC/USD chart, the possibility of a double top is emerging. If this pattern plays out, selling momentum could breach the flag’s support and drive prices down to the order block support at $12,750 before a potential rebound. Should that occur, Bitcoin may attempt to re-enter the flag pattern, only to face further resistance and breakdown to lower levels.
Looking at the Relative Strength Index (RSI) on this timeframe, each price rally has resulted in a lower high on the indicator, signaling a weakening uptrend. This suggests that unless buying pressure picks up significantly, the bears could soon take control and push prices lower.


