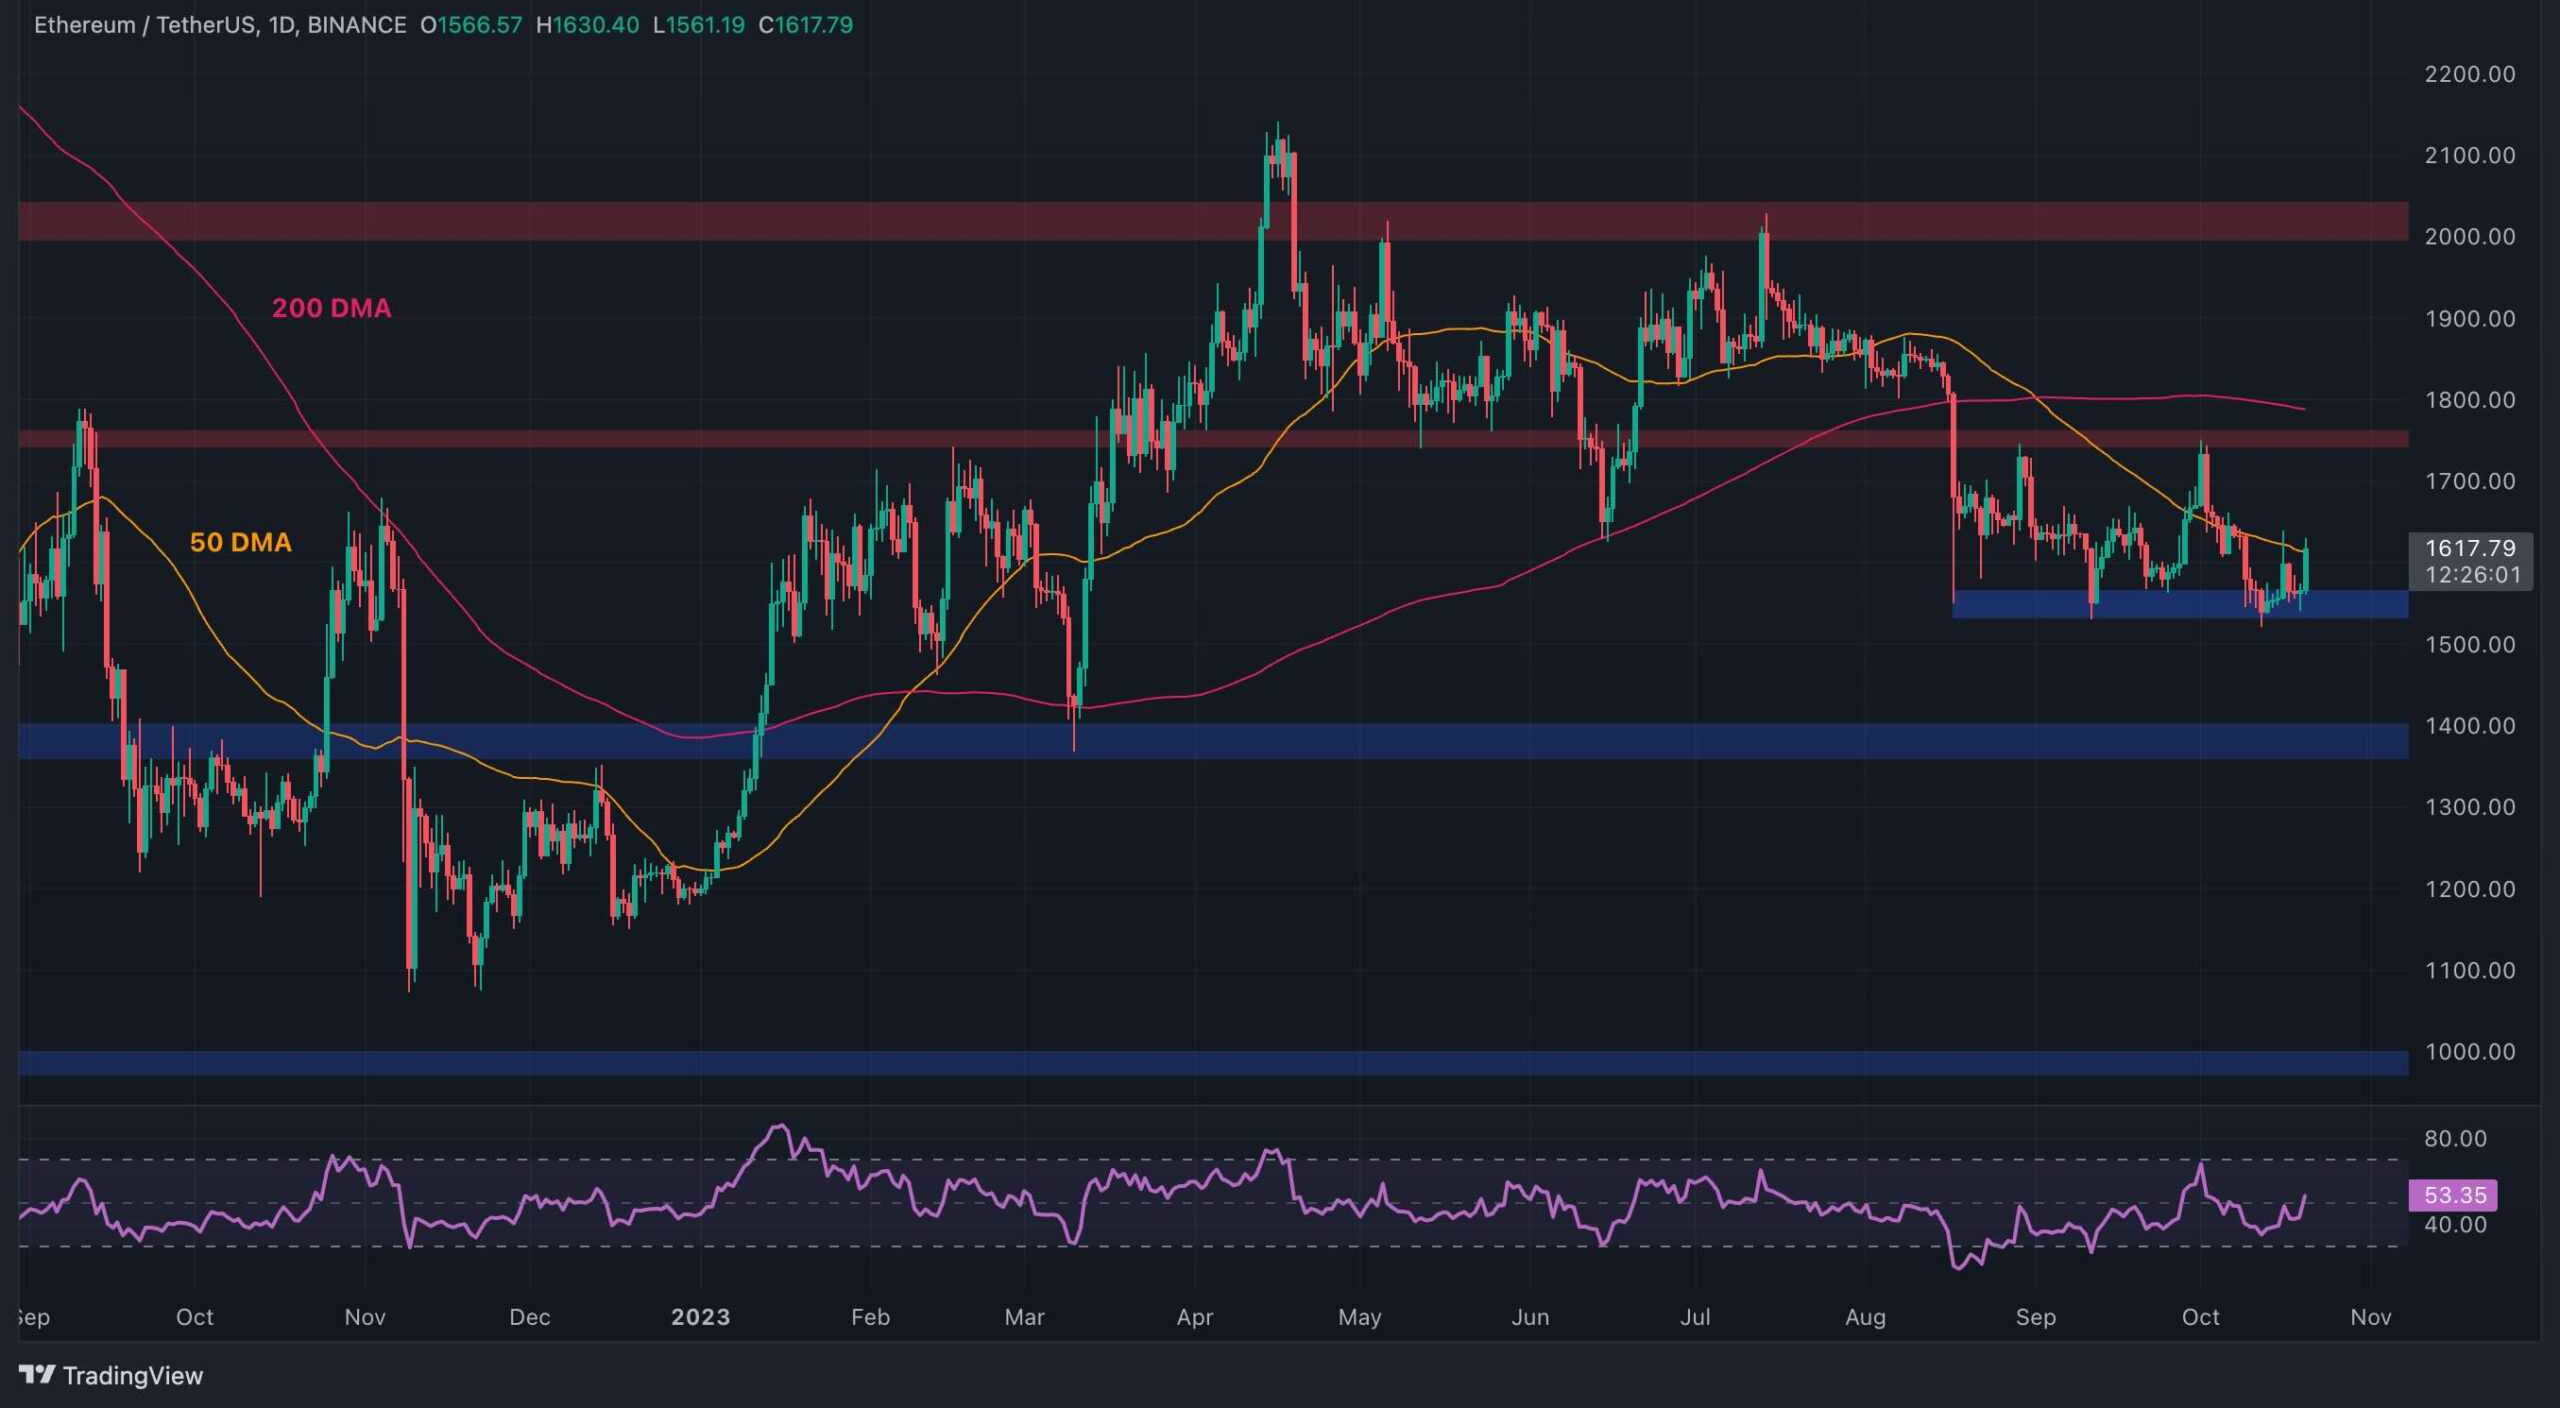
On the daily chart, Ethereum’s price has found support at the $1,550 level once again, preventing further decline towards the $1,400 area. The 50-day moving average is currently being tested around the $1,600 mark.
A successful break above this level would likely lead Ethereum towards the $1,750 resistance, with the 200-day moving average around $1,800 as the next key target. The RSI has also surpassed the 50% threshold, signaling that bullish momentum is once again in play.
On the 4-hour chart, Ethereum has been consolidating between $1,550 and $1,750 for an extended period. However, recent price action has seen a rebound from the $1,550 level, and the price is currently testing the $1,600 resistance.
A bullish breakout above this resistance could pave the way for a move toward the $1,750 level in the upcoming weeks. However, caution is advised as the RSI is nearing overbought territory, which may lead to a potential rejection at the $1,600 level.
Ethereum’s recent upward movement comes after a prolonged consolidation period and gradual decline. As the price begins to rise, investors are left questioning whether a new bullish phase is imminent or if further downside remains in play.
The 100-day moving average of the taker buy-sell ratio is a crucial indicator of sentiment in the futures market. Takers, the market participants who place aggressive orders at market price, drive price movements. A value above 1 suggests bullish sentiment, while below 1 indicates bearish sentiment. Recently, the taker buy-sell ratio has increased but remains below 1. Should this trend continue and the ratio surpass 1, a new rally could take place, potentially breaking the $2,000 resistance. If the ratio fails to climb above 1, however, the market may experience further downward pressure.