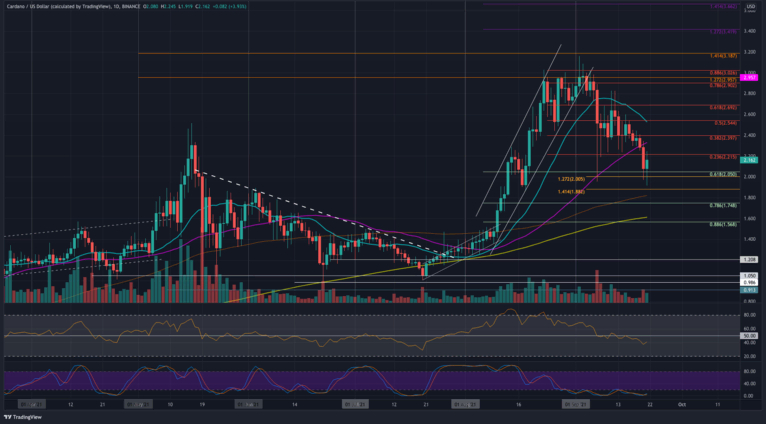
Cardano (ADA) faced a temporary setback during yesterday’s market downturn, briefly falling below $2, but quickly found its footing as buyers stepped in to maintain support at this crucial price point. Despite experiencing a 10% decrease over the last week, the $2 mark has become an important support level, with ADA bouncing back from the 0.618 Fibonacci retracement at $2.05.
Earlier, Cardano had established a strong base around $2.40, but the market’s sharp decline led ADA to dip below this threshold, touching $2.30 before eventually finding support at $2.05. In fact, ADA briefly dropped below $2, reaching as low as $1.91, but swiftly recovered.
Looking ahead, ADA’s immediate support level sits at $2.05, which coincides with the 0.618 Fibonacci level, followed by further support at $2.00, $1.88 (downside 1.414 Fibonacci extension), $1.80 (100-day moving average), and $1.75 (0.786 Fibonacci level).
On the resistance side, the first notable resistance emerges at $2.21 (bearish 0.236 Fibonacci), followed by $2.33 (50-day moving average), $2.40 (bearish 0.382 Fibonacci), $2.55 (bearish 0.5 Fibonacci and 20-day moving average), and $2.70 (bearish 0.618 Fibonacci).
Although the Relative Strength Index (RSI) remains below the neutral 50 level, indicating bearish momentum, the recent price rebound suggests that support is holding, and the potential for upward movement remains intact.
In the ADA/BTC pair, support was established at 4800 SAT during the broader market selloff, allowing ADA to bounce back above the 5000 SAT mark. ADA had dipped beneath 5000 SAT earlier in the weekend, but strong buying pressure quickly pushed the price back up.
Since then, ADA has risen above its 50-day moving average and is currently testing the May 2021 highs. This price action indicates that the market could be gearing up for a possible upward move if it maintains its position above these critical levels.
On the upside, the first resistance for ADA/BTC lies at 5050 SAT, aligning with the May 2021 highs. This is followed by resistance at 5400 SAT (20-day moving average), 5800 SAT, and 6000 SAT.
To the downside, support remains at 5000 SAT (50-day moving average), with additional support at 4715 SAT (0.5 Fibonacci), 4600 SAT, and 4350 SAT (a combination of the 0.618 Fibonacci and 100-day moving average).
Similar to ADA/USD, the RSI for ADA/BTC remains below the midline, suggesting that bearish momentum still dominates. However, the recent rebound has helped ease the selling pressure, and a further push above the 5000 SAT level could indicate the beginning of a potential trend reversal.