Bitcoin’s price remains trapped within a narrow range after falling below the 50-day moving average, creating uncertainty regarding its next significant move. Meanwhile, on-chain metrics indicate heightened selling activity from miners, which could further influence price direction.
Daily Chart Overview
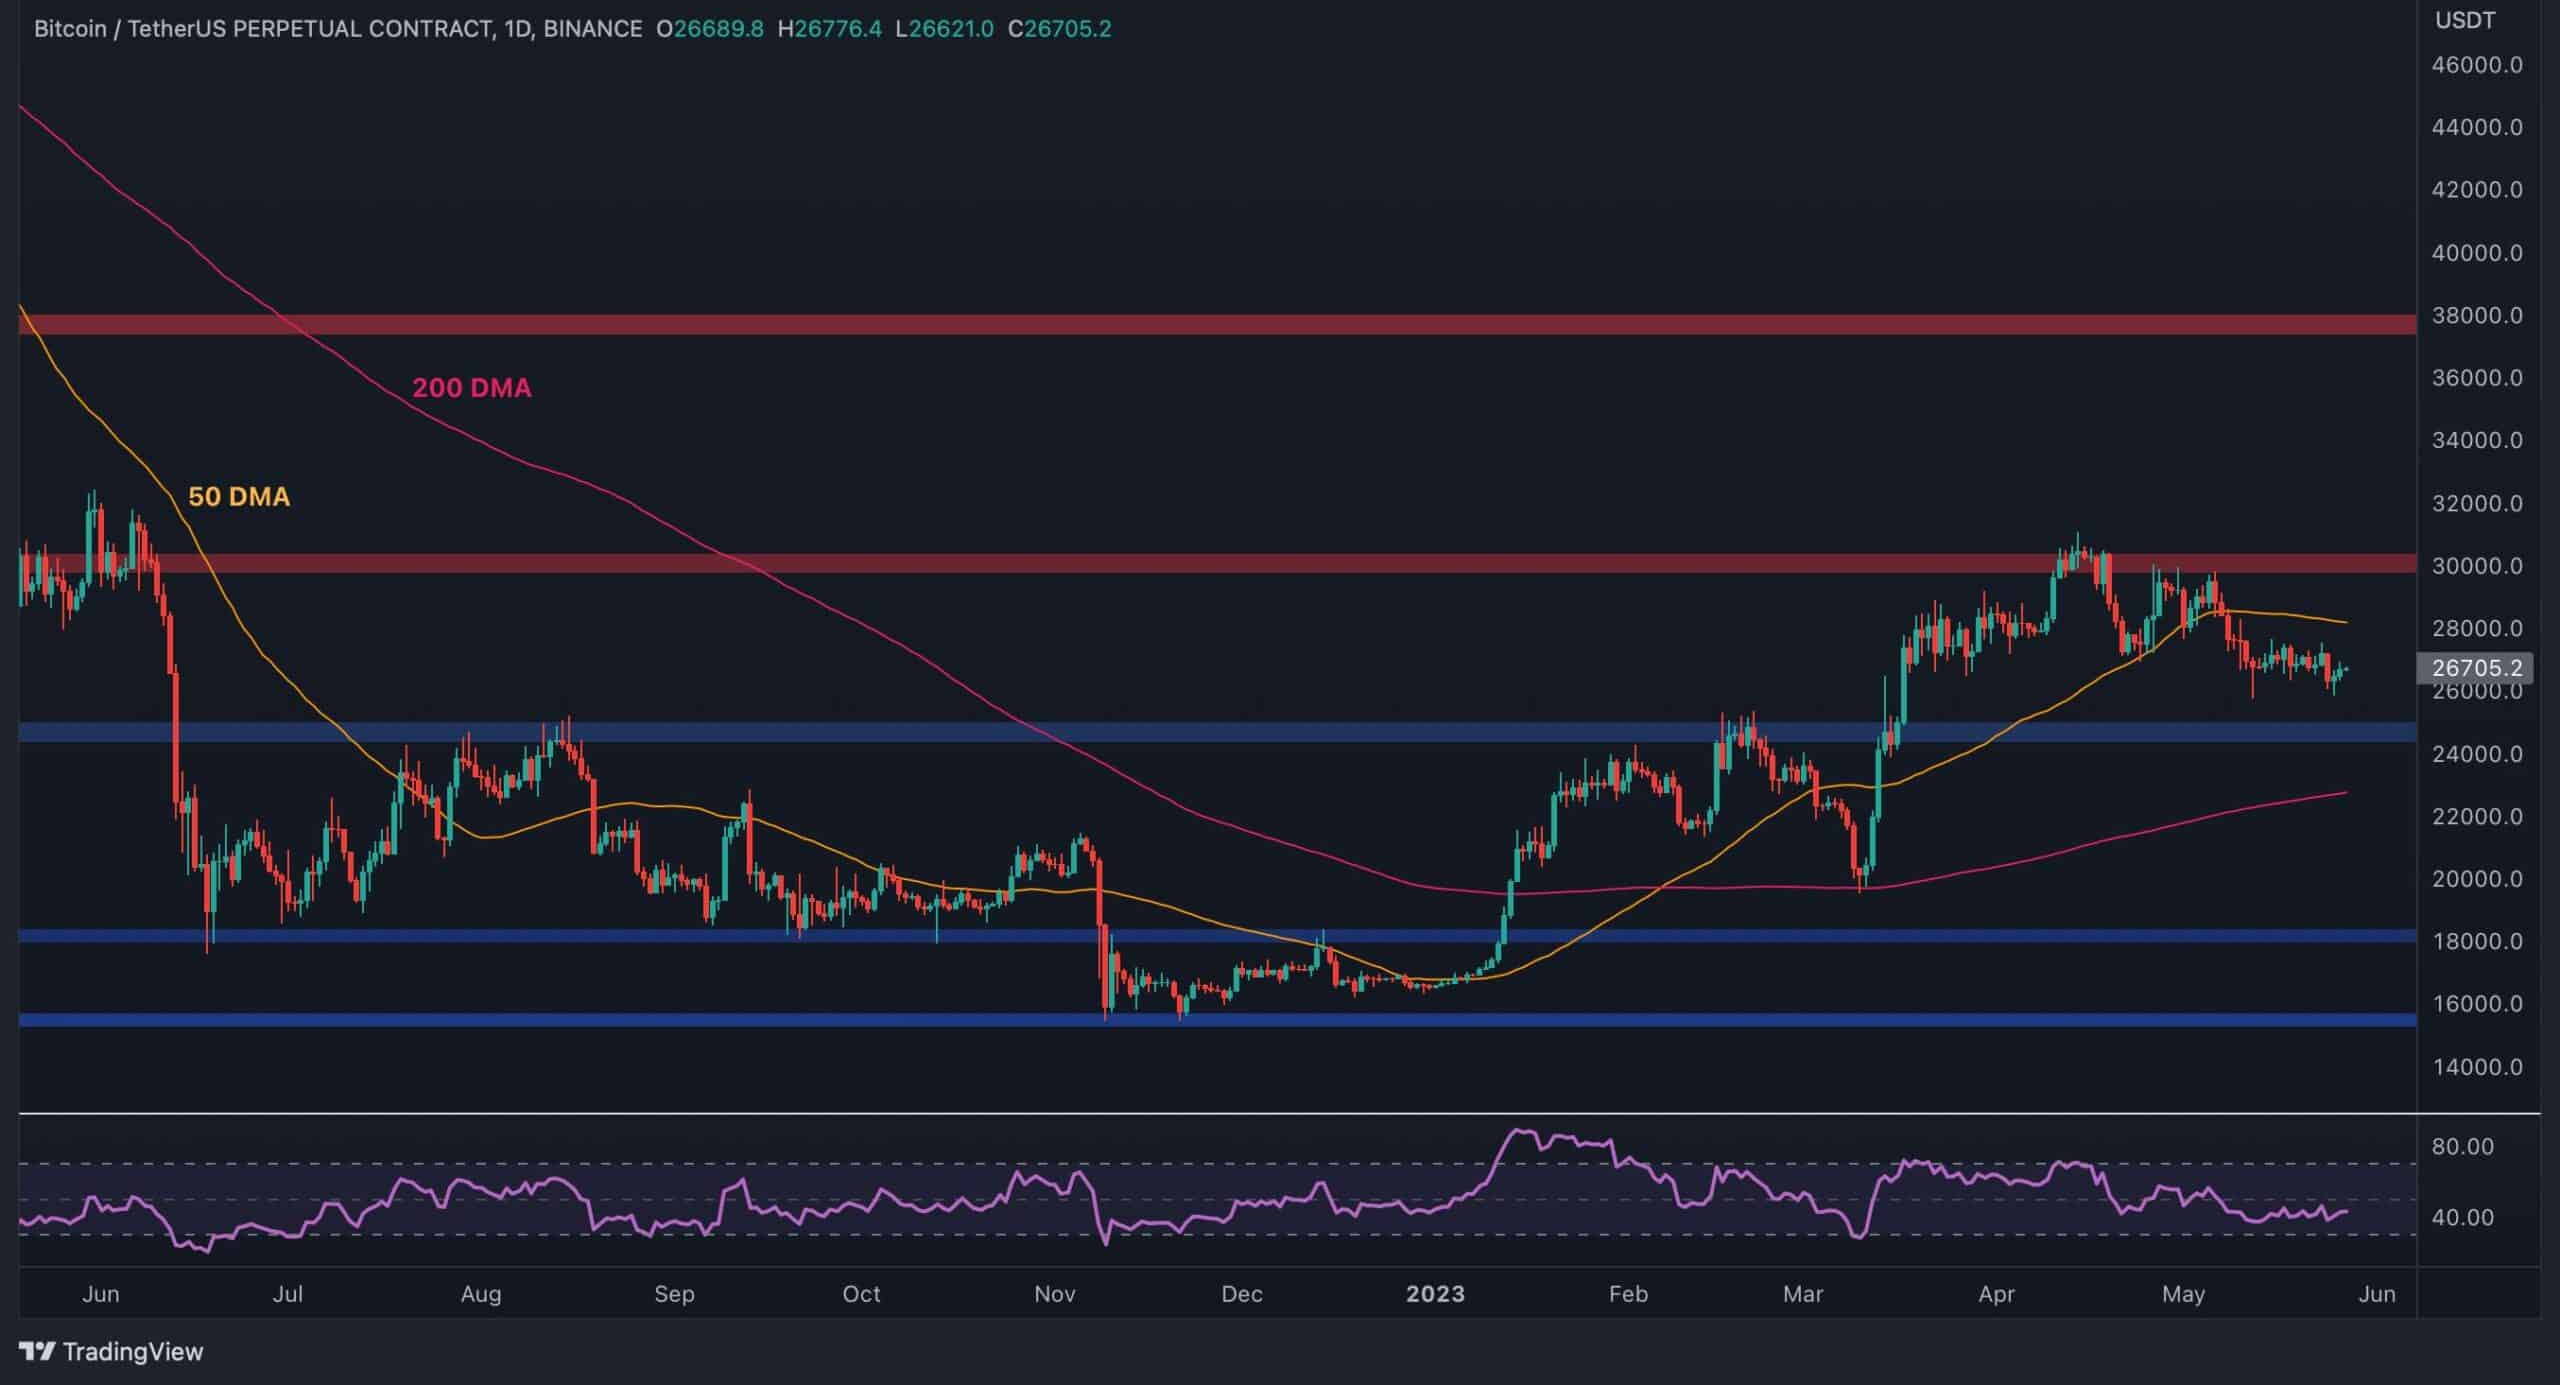
Bitcoin’s price continues to consolidate without notable movements on the daily chart. Should a rally occur, the initial resistance level to watch is the 50-day moving average near $28K, followed by the critical $30K resistance zone.
On the downside, the $25K level and the 200-day moving average at approximately $23K are key support areas. The RSI remains below 50%, reinforcing the bearish momentum and signaling a higher likelihood of further declines in the short term.
4-Hour Chart Insights
On the 4-hour chart, Bitcoin is trading within a descending channel. A minor bounce from the $26K support level temporarily halted the decline, but the price remains vulnerable to a drop toward the channel’s lower boundary and the $25K support area.
For bullish momentum to return, Bitcoin must first surpass the $27,500 resistance. A successful breakout could lead to a test of the $30K resistance and potentially invalidate the descending channel pattern.
Bitcoin Miner Reserve Metric
While Bitcoin’s price remains range-bound, on-chain data offers insights into market dynamics. The miner reserve metric, which tracks the amount of Bitcoin held by miners, shows a steady decline over the past nine months.
This trend reflects sustained selling by miners, likely to cover operational costs or mitigate risks amid an uncertain macroeconomic environment. Notably, the selling has intensified recently, suggesting that miners are taking advantage of the price increase to liquidate holdings.