Bitcoin’s price, which has been on an upward trajectory since the start of 2023, is now signaling a potential reversal after failing to break above the critical $30K resistance level.
Daily Chart Overview
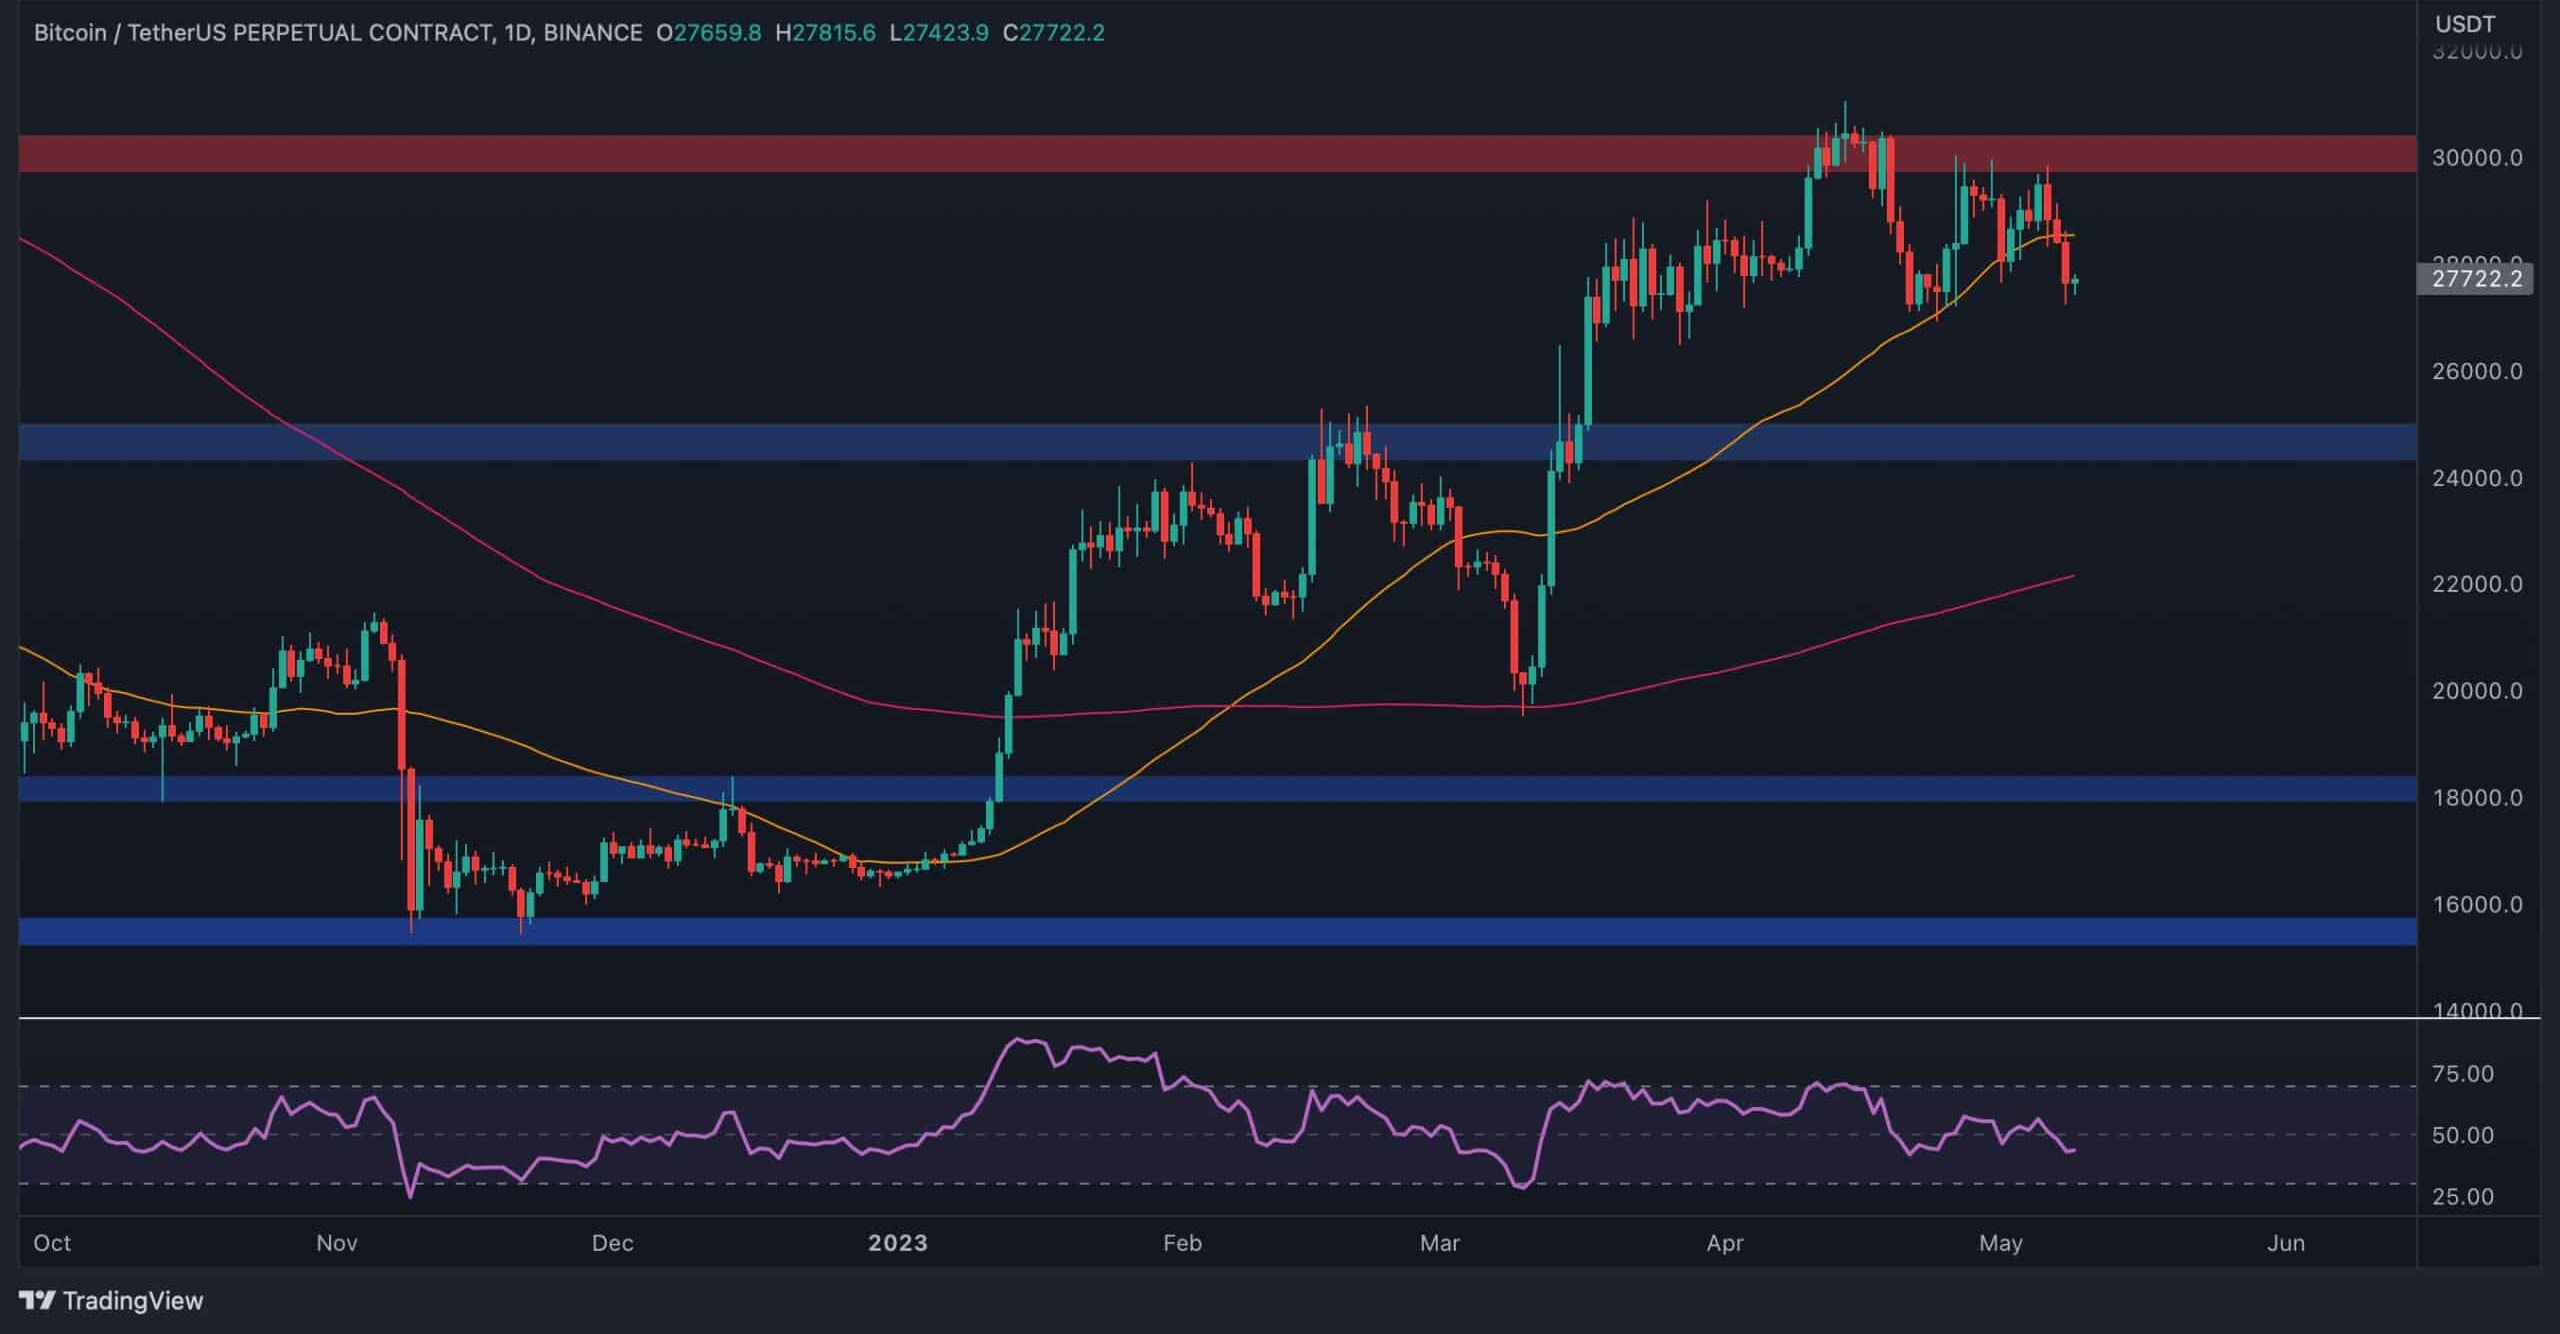
Following its rejection at $30K, Bitcoin has entered a consolidation phase. The 50-day moving average, which had been acting as support, is now being tested and breached around the $28K mark.
If this bearish breakout holds, the price is likely to target the $25K support zone next, with the 200-day moving average around $22K acting as a further safety net. The RSI has also slipped below the 50% mark, indicating waning bullish momentum and a potential continuation of the decline in the short term.
4-Hour Chart Insights
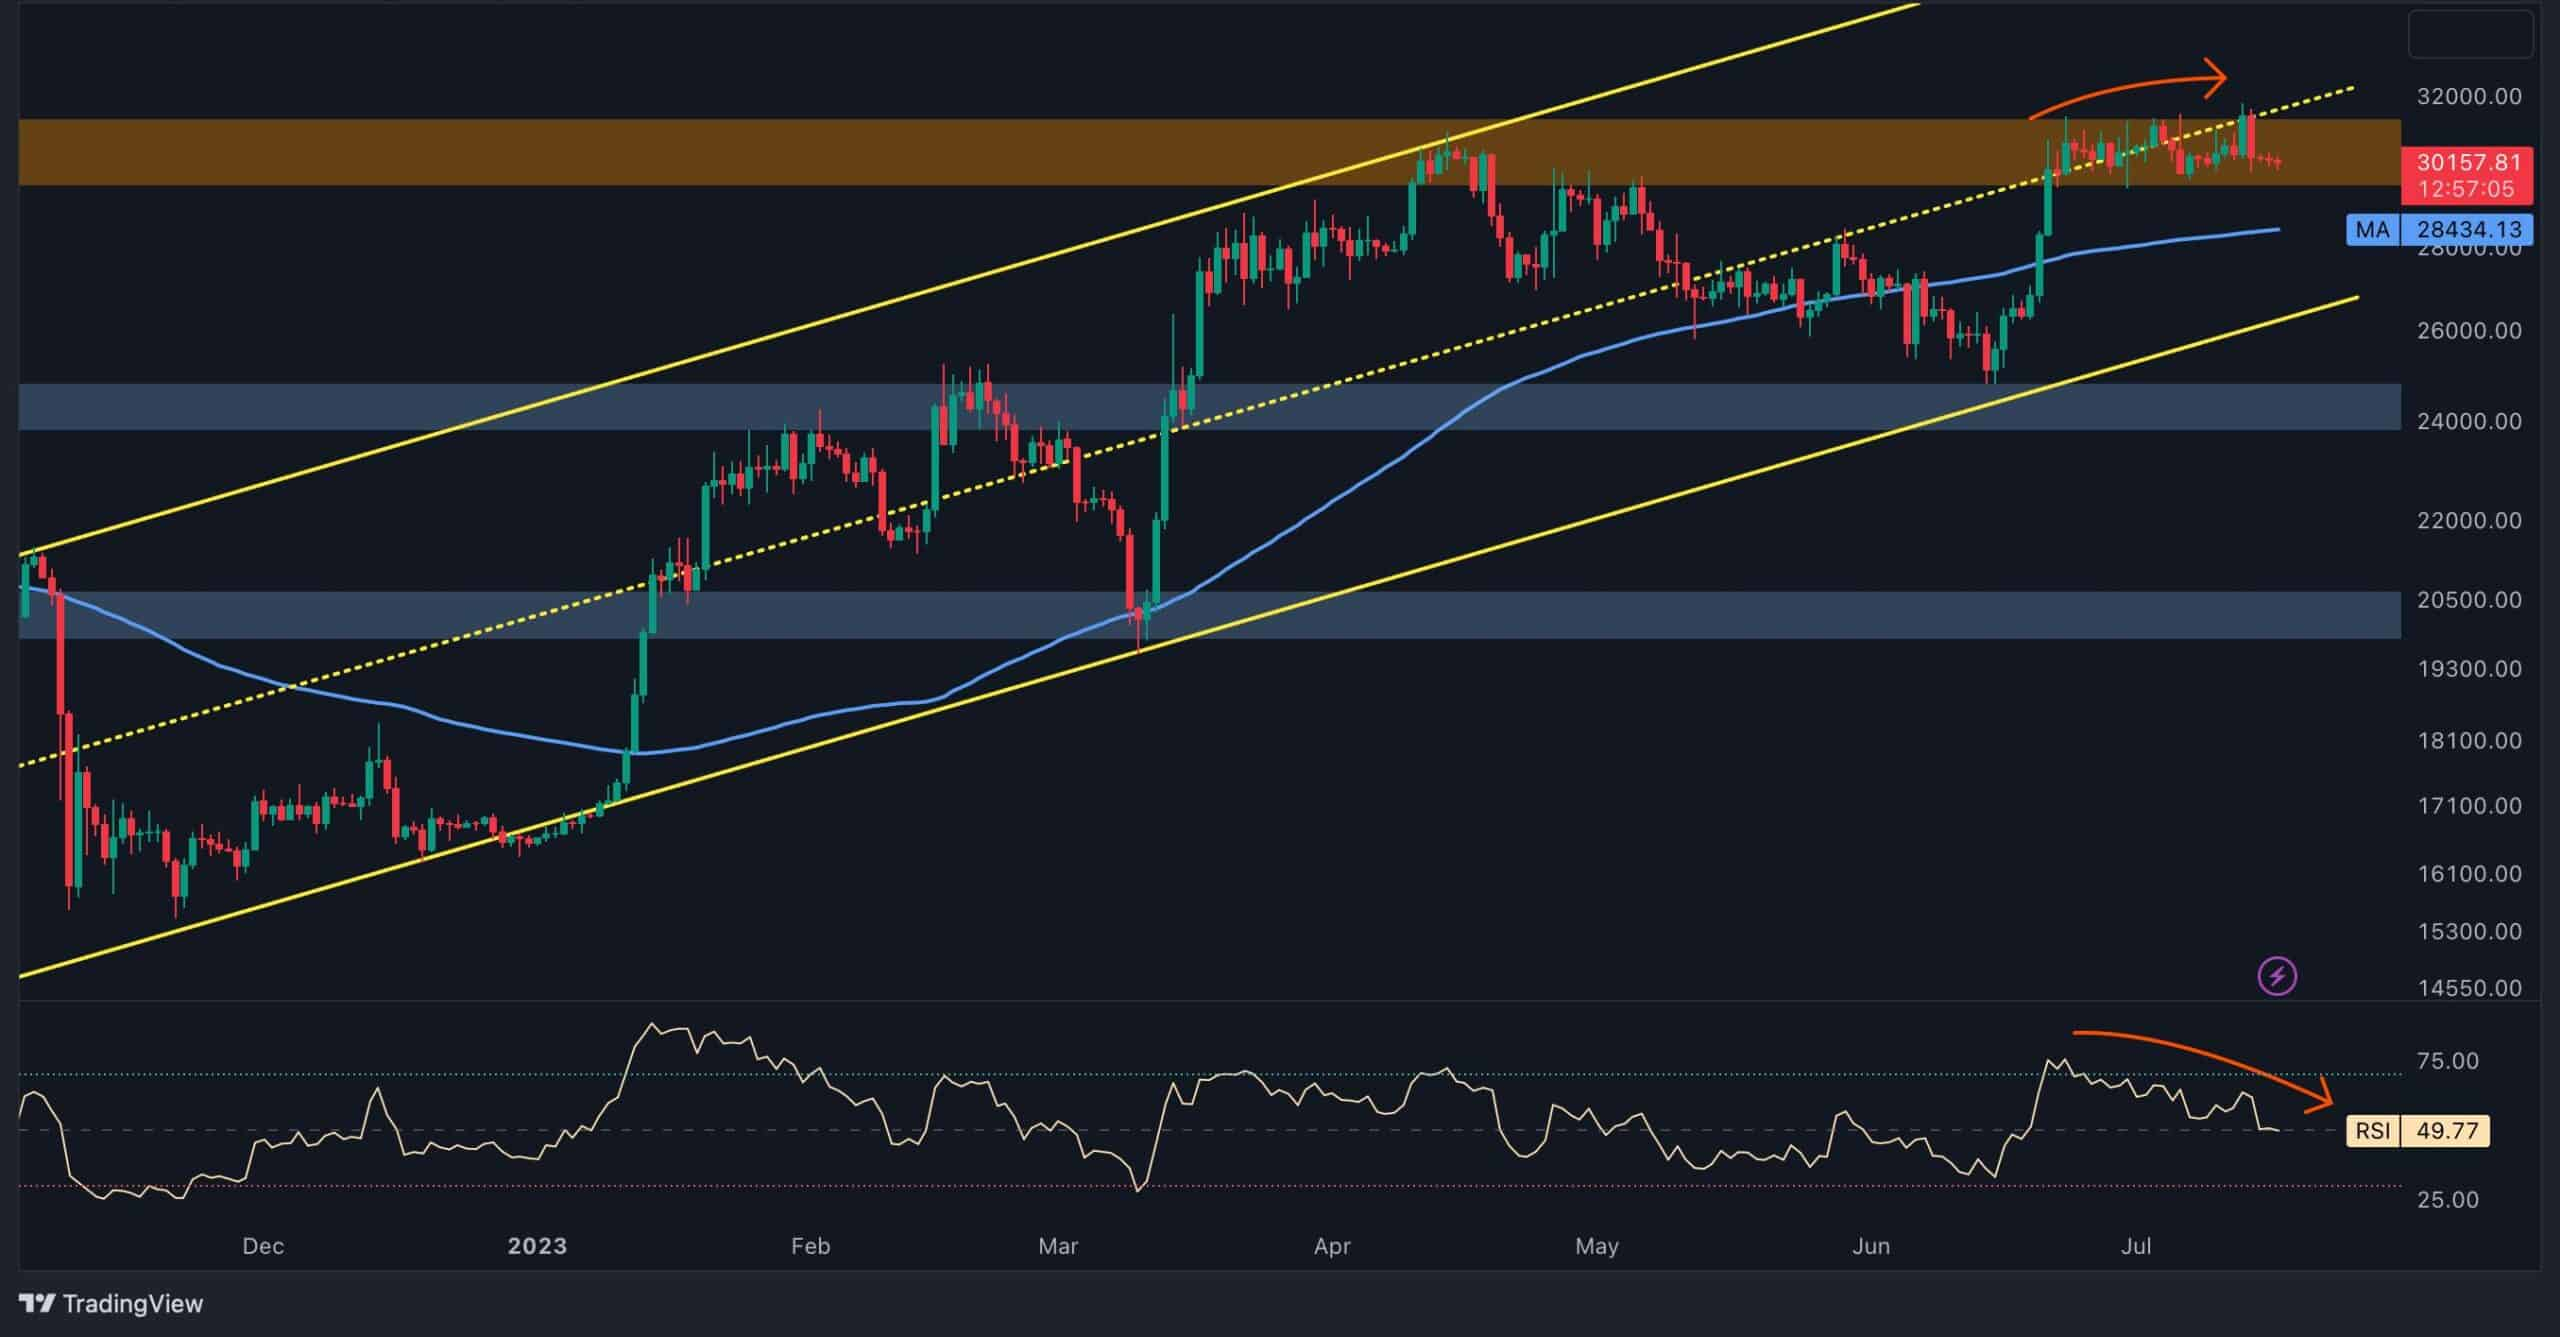
On the 4-hour timeframe, Bitcoin’s price has been oscillating between $30K and $28K. Currently, it is retesting the $28K support level. A breakdown below this level could trigger a sharp drop toward $25K in the near future.
However, with the RSI nearing the oversold region, a bounce from $28K is also possible. Such a rebound could propel Bitcoin back toward the $30K resistance. Despite this possibility, the bearish scenario appears more likely based on classic price action analysis across both daily and 4-hour charts.
On-Chain Analysis
Bitcoin transaction activity surged significantly on Sunday, leading to a notable increase in miner fees. This trend, while uncommon during bear markets, often coincides with bull market peaks.
The spike in fees can be attributed to the growing adoption of the Taproot upgrade, enabling NFTs and BRC-20 tokens on the Bitcoin blockchain. While higher fees might deter routine transactions, they boost miner earnings, which can be viewed positively for the network.
Additionally, other on-chain metrics, such as the number of active addresses and transactions, have seen substantial growth. This activity could hint at the early stages of a bull market, despite the recent price correction.


