The cryptocurrency market, after an extended phase of consolidation, has finally witnessed a correction. Most coins, including Ethereum, have experienced notable declines. Ethereum’s price dropped by 14%, reaching a significant support zone.
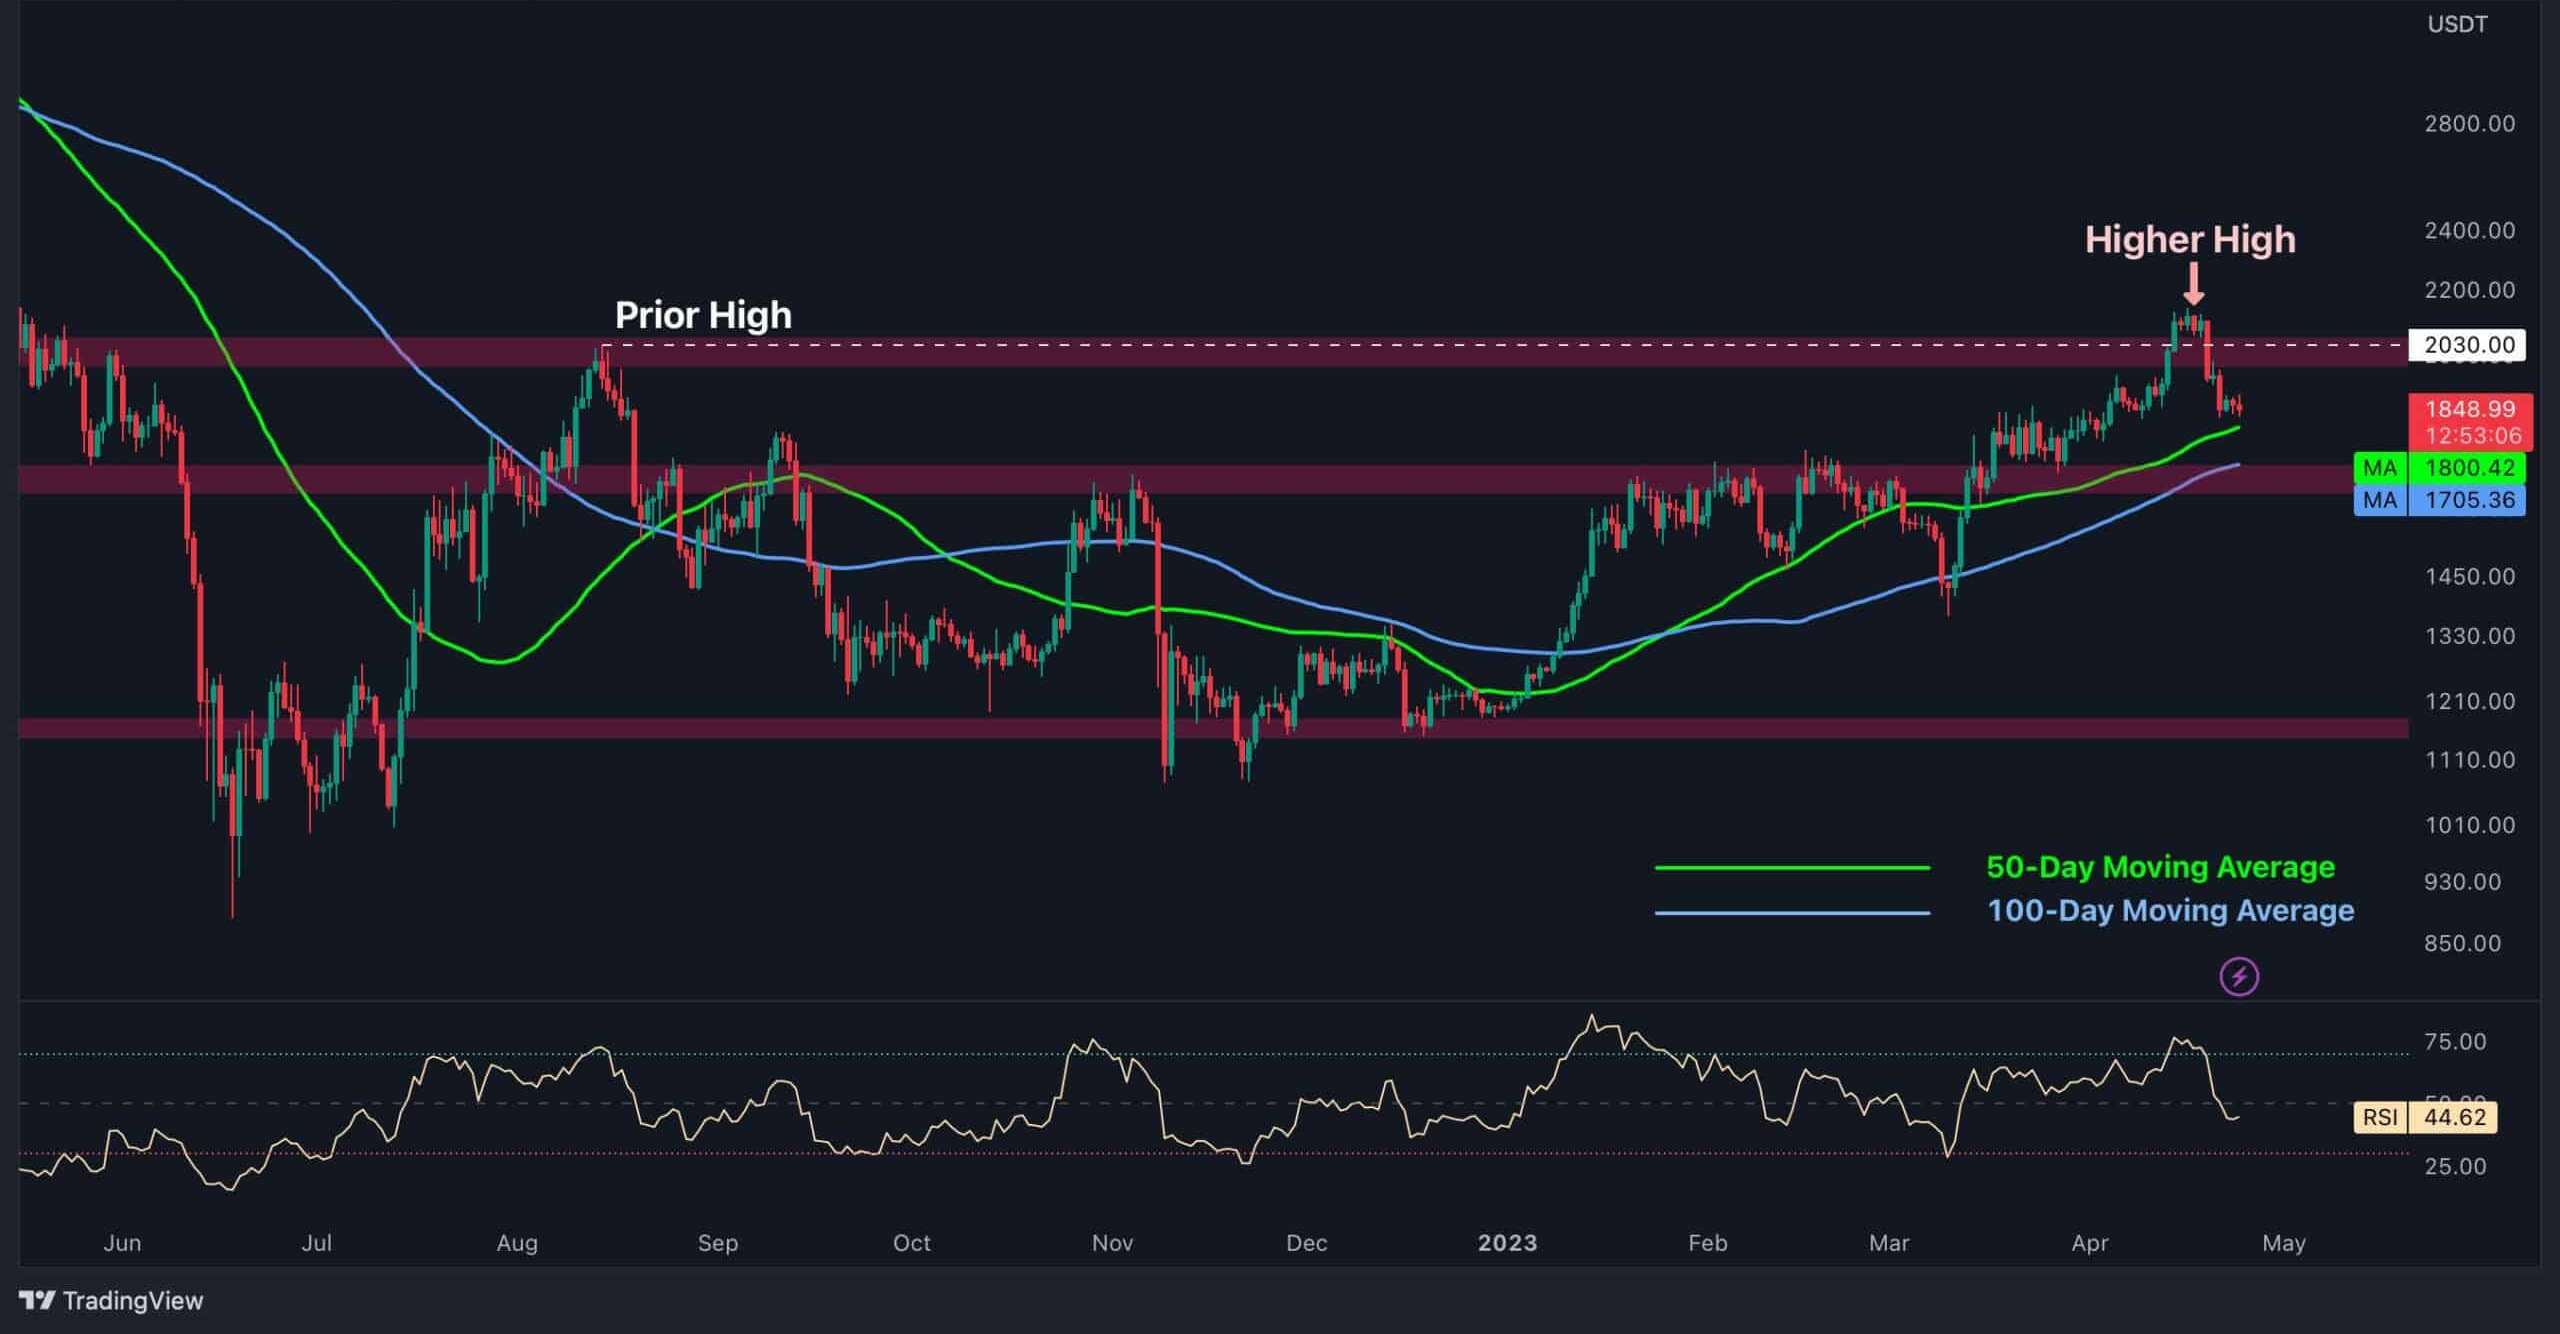
Daily Chart Overview
Ethereum recently broke above its previous key swing high of $2,000 during a strong uptrend, which fueled bullish momentum and signaled a potential trend reversal. However, this positive sentiment was short-lived, as the price formed a head-and-shoulders reversal pattern and subsequently dropped by 14%.
The decline has brought Ethereum to a critical support zone defined by the 50-day moving average at $1,800 and the 100-day moving average at $1,705.
The price movement within the $1,700–$1,800 range is crucial, as a decisive breakout below this area could set the stage for further declines. If the support fails to hold, the next key level to watch is the prior major swing low at $1,400, which could act as mid-term support.
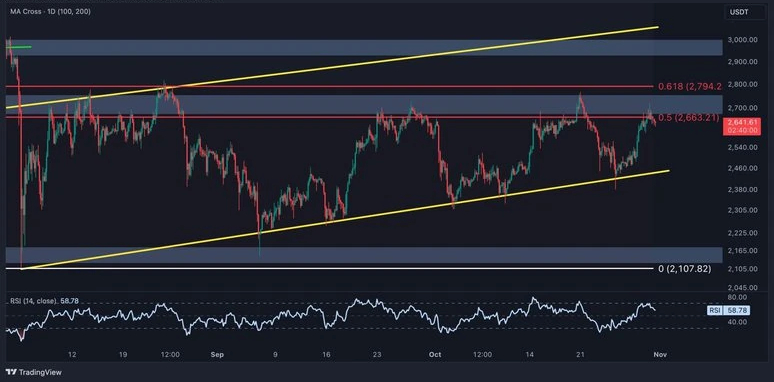
4-Hour Chart Analysis
On the 4-hour chart, Ethereum’s rally ended when it failed to break above the upper trendline of the channel at $2,100. Following this rejection, the price dropped sharply and is now testing the middle boundary of the channel, which represents a key support/resistance zone.
Should Ethereum break below this level, it may trigger a continuation of the downtrend, targeting the $1,700 mark. Conversely, if ETH finds support at this level, a rebound toward the channel’s upper trendline would become the most likely scenario in the short term.