Ethereum has successfully surpassed a critical resistance level, continuing its rally. However, the RSI is showing warning signs that may indicate a potential reversal or consolidation.
Daily Chart Analysis
On the daily chart, Ethereum has managed to break through the previously challenging $1800 resistance level after multiple attempts. The upper boundary of the large symmetrical triangle pattern has provided additional support, helping push the price higher above the $1800 mark earlier in the week.
Looking ahead, the price could potentially target the $2300 level based on traditional price action patterns. However, the RSI is approaching overbought conditions, which could signal a correction or even a trend reversal.
If a pullback occurs, the $1800 area may act as a critical support level, potentially preventing a deeper decline.
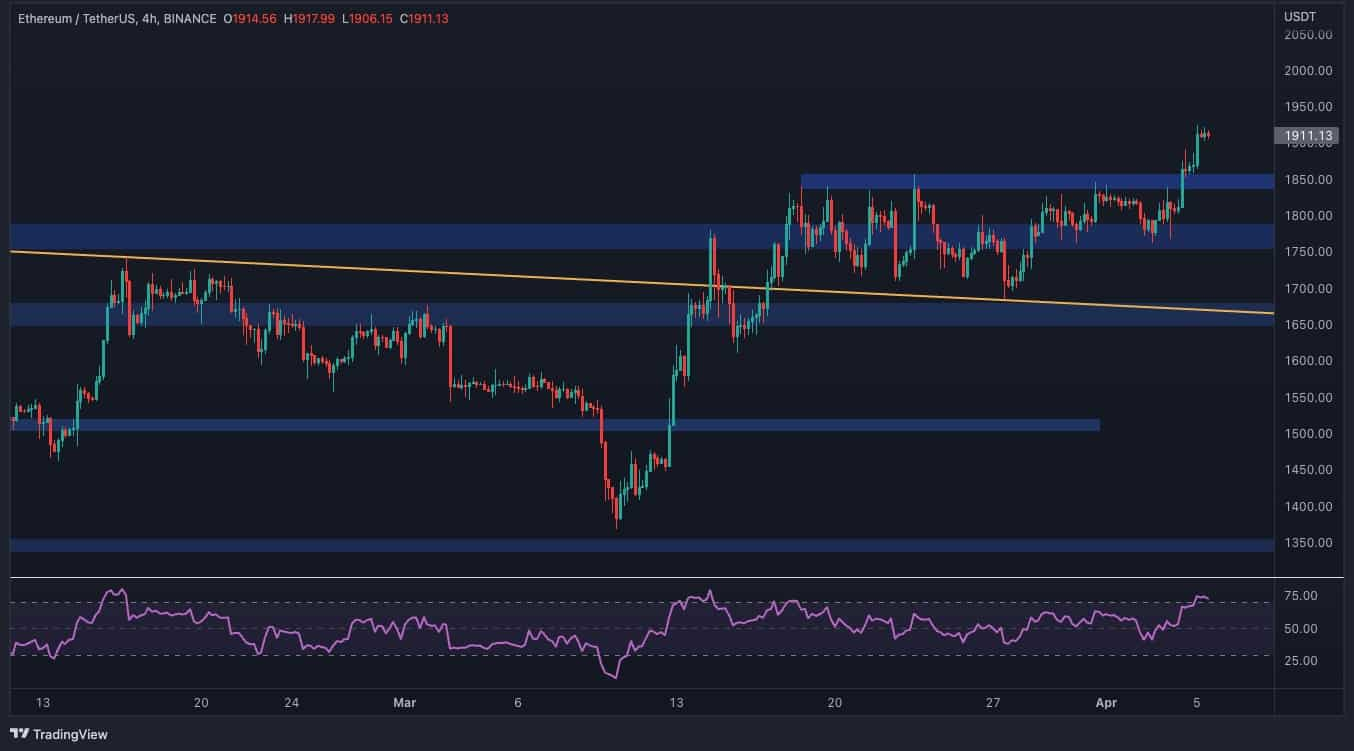
Ethereum’s 4-Hour Chart: Bullish Momentum at Risk
On the 4-hour chart, Ethereum has broken out of the consolidation phase between the upper boundary of the symmetrical triangle and the $1850 resistance level.
This breakout is a bullish signal, indicating that the price is setting higher highs. However, the RSI on this timeframe is showing overbought conditions, which suggests a possible short-term pullback or reversal.
In the event of a correction, the $1850 level, followed by $1800 and the upper trendline of the triangle pattern, could be key levels to watch for potential support.
Sentiment Analysis: Futures Market Points to Possible Correction
Ethereum’s price continues to trend higher, establishing new peaks and troughs. Despite this bullish movement, the futures market is signaling that a correction or reversal may be on the horizon.
Ethereum’s Open Interest is a metric that gauges sentiment in the futures market. High open interest typically signals greater market volatility, while lower open interest suggests a more stable market with steadier price movements. Recently, Open Interest has surged as Ethereum approaches the $2000 level. Historically, sharp increases in Open Interest have often been followed by bearish pullbacks or full trend reversals. Given this, a decline in price seems likely, and a small drop could trigger a long liquidation cascade, leading to a significant price drop.