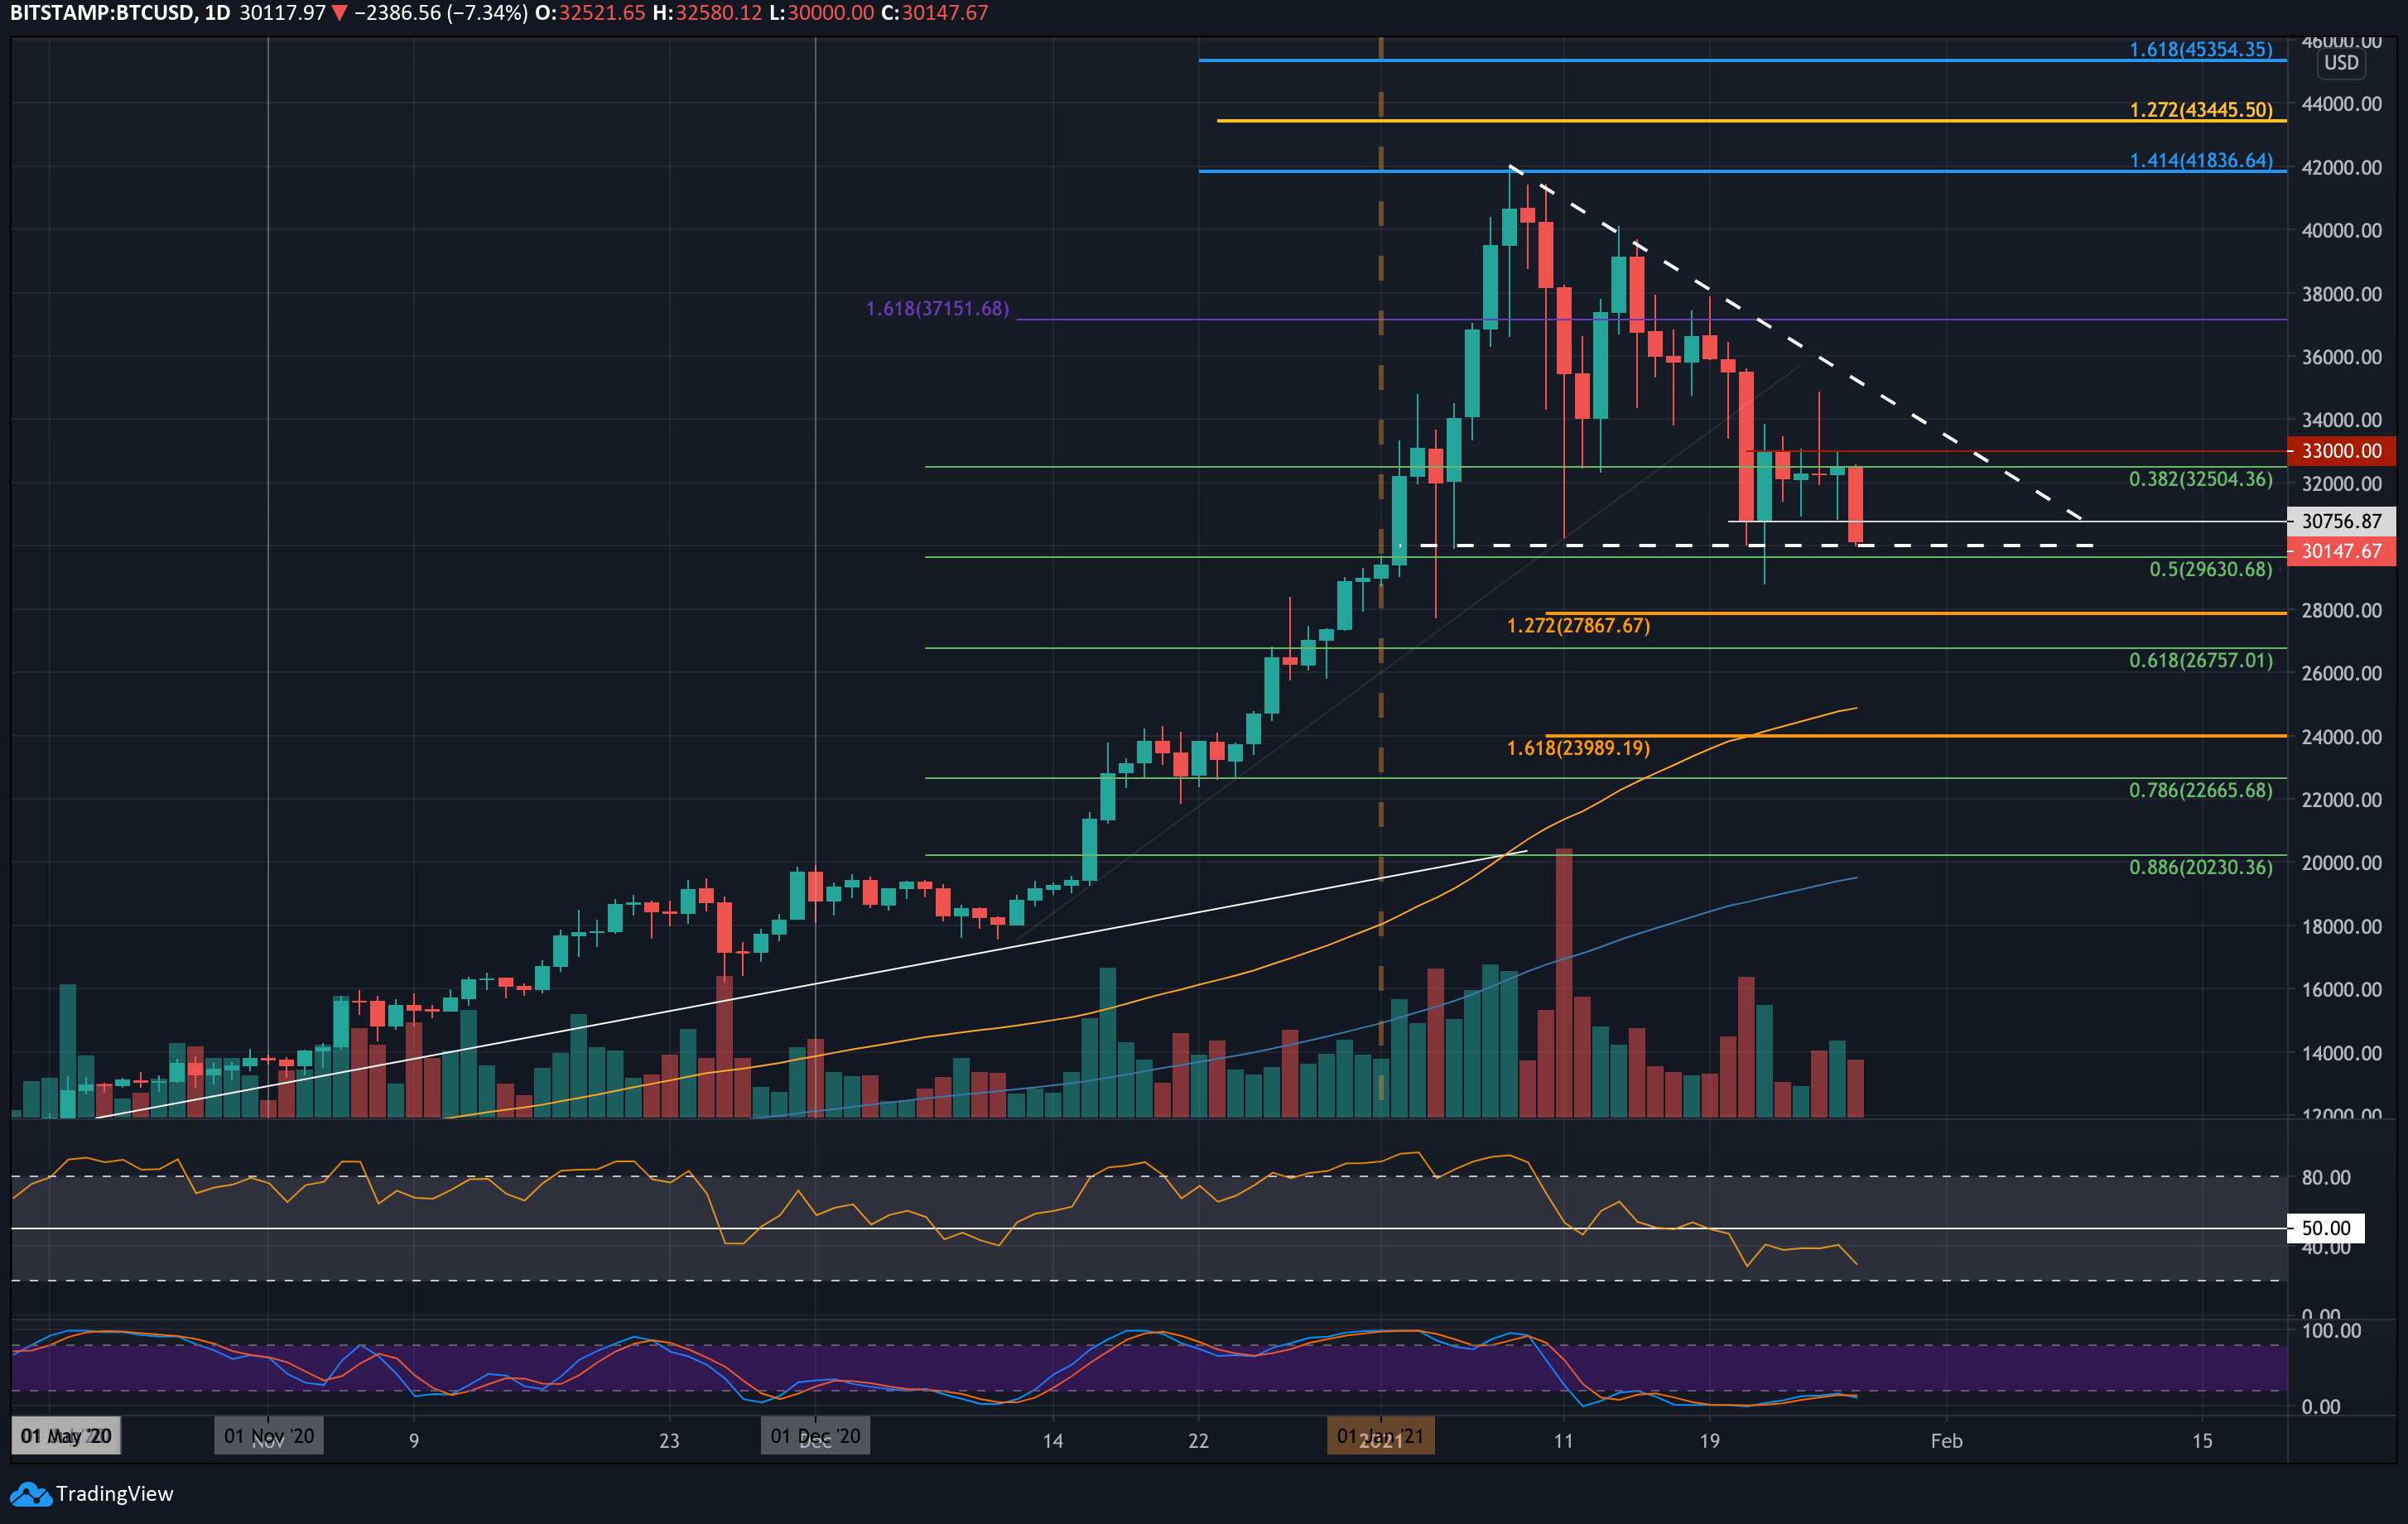
After opening at $32,500 on Bitstamp, Bitcoin has experienced a decline of nearly 7%. The failure to maintain this level, combined with the breach of a rising trendline, suggests that further price drops are likely. In addition, the formation of a Head and Shoulders pattern points toward a potential decline, with projections indicating a range of $28,000 to $29,000.
Following the loss of significant support at $30,760 (.786 Fibonacci), Bitcoin is now hovering around $30,150. A daily candle closing at this level would confirm the breakdown of a six-day consolidation, previously confined within a range of $33,000 to $30,760.
On a broader scale, the $30,000 level plays a crucial role as the lower boundary of a descending triangle. A move below this price could open the door to a potential decline to $28,000 or even $26,000 in the short term. The RSI, which currently signals a bearish trend, further supports the expectation of downward pressure in the near future.
If Bitcoin fails to maintain the $30,000 level, additional support levels can be found around $29,630 and $28,500. Conversely, resistance levels are located at $30,760, with further obstacles at $32,500 and $34,000.
Given the cautious market sentiment and the current bearish reading from the RSI, there is a strong likelihood of continued downward movement in the coming days.