XRP is currently consolidating above its 50-day moving average against USDT at approximately $0.48. This price level follows another rejection at the $0.6 resistance, which continues to limit upward momentum.
XRP/USDT Daily Chart
XRP’s price remains precariously balanced above the 50-day moving average. A breakdown below this level could result in a decline towards the next support at $0.43, aligned with the 200-day moving average. If both these levels are breached, the market might witness a sharper drop towards the $0.3 range.
Despite these bearish signals, it is too early to adopt a fully pessimistic outlook. The possibility of a rebound from current levels remains viable, potentially enabling XRP to retest the $0.6 resistance zone.
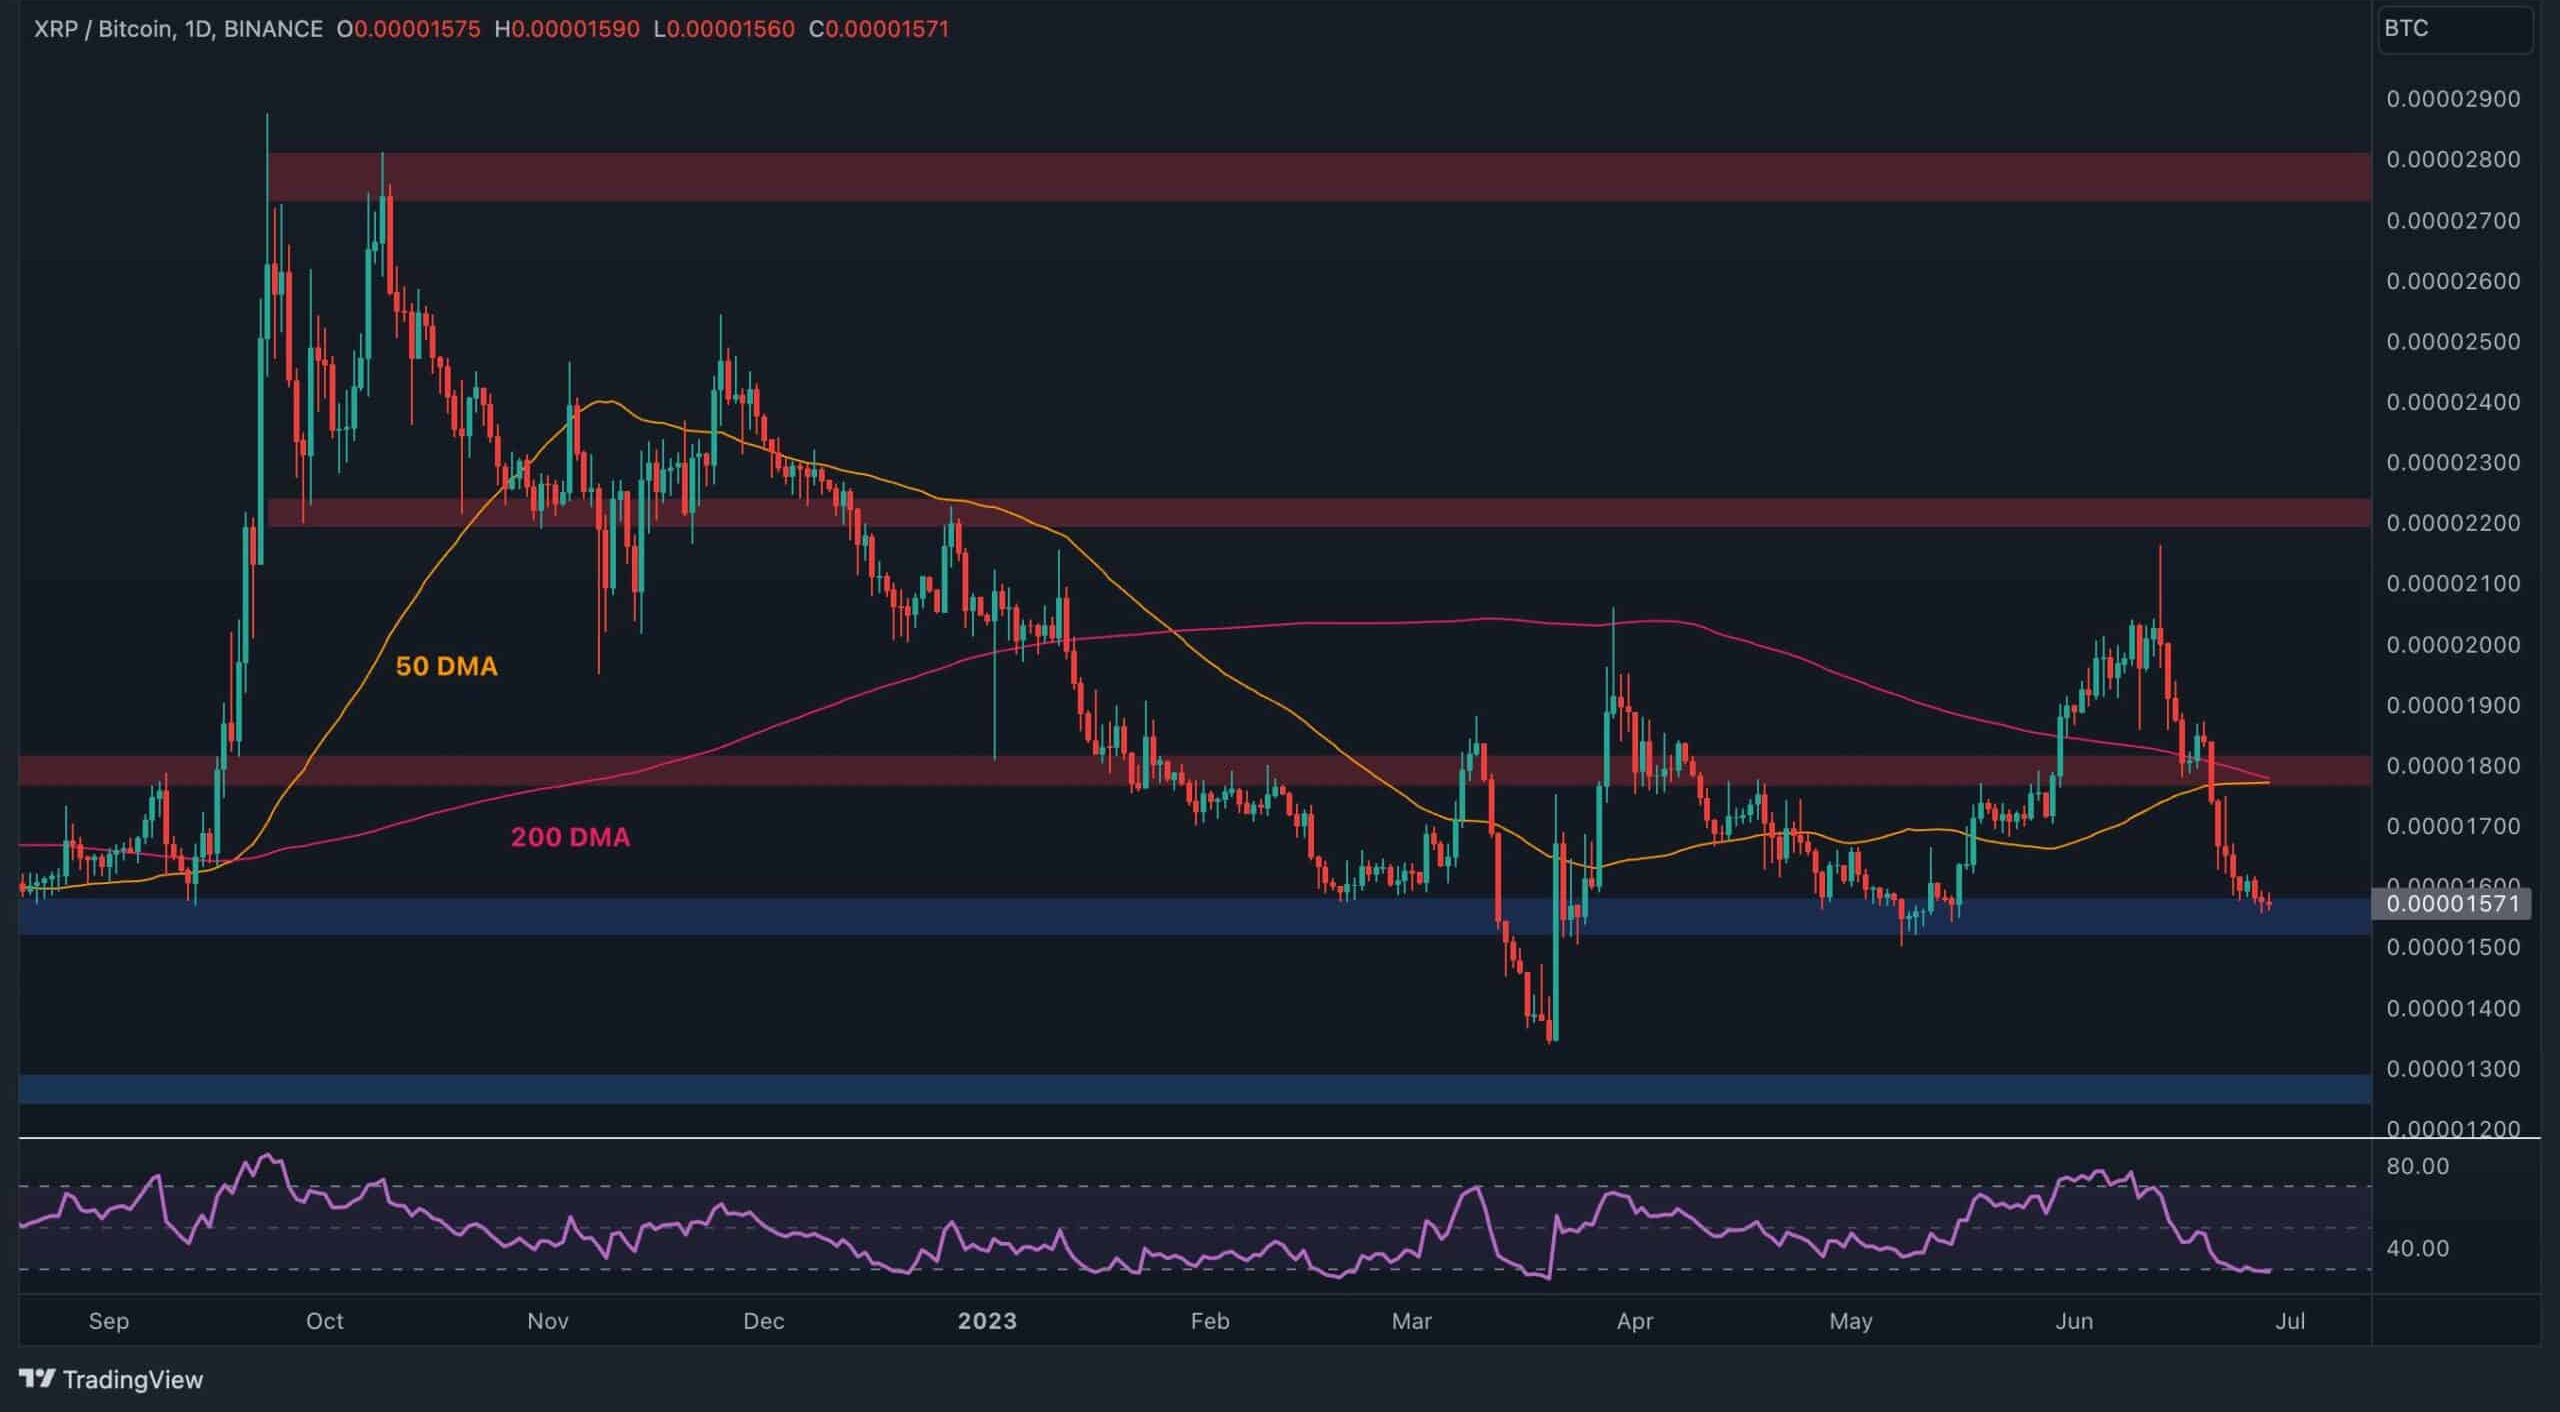
XRP/BTC Daily Chart
XRP’s performance against BTC has been under significant pressure, marked by a steady decline over recent weeks. The price has fallen below both the 50-day and 200-day moving averages and is now testing critical support at 1500 SAT.
The RSI indicator suggests that XRP is currently oversold, increasing the likelihood of a short-term pullback or rebound. Should this rebound materialize, the first targets would be the converging 50-day and 200-day moving averages at around 1800 SAT.