Bitcoin is down by a modest 1.5% today, struggling to maintain support around the $33,000 level. Throughout the first half of July, Bitcoin has been trading within a tight range between $36,000 and $32,000, signaling a potential upcoming breakout in either direction.
Volume has remained notably low in July, particularly during the last two weekends, which recorded the lowest trading days. This persistent low volume, combined with an extended period of consolidation, has left traders on edge, anticipating a major price movement that will likely set the tone for the next trend. While both bullish and bearish scenarios are possible, the current market indicators seem to lean toward a bearish outlook.
The uncertainty surrounding Bitcoin’s price action is further amplified by the $550 million GBTC shares unlock scheduled for this Sunday. This event has likely contributed to the caution observed in the market, with traders awaiting resolution before making significant moves. It seems a substantial price movement might not materialize until after the unlock is factored into the market.
Looking at the broader picture, Bitcoin has been trading within the $30,000 to $42,000 range since the May 19 price collapse. However, this range has been narrowing in recent weeks, and Bitcoin is now primarily trading between $32,000 and $33,000.
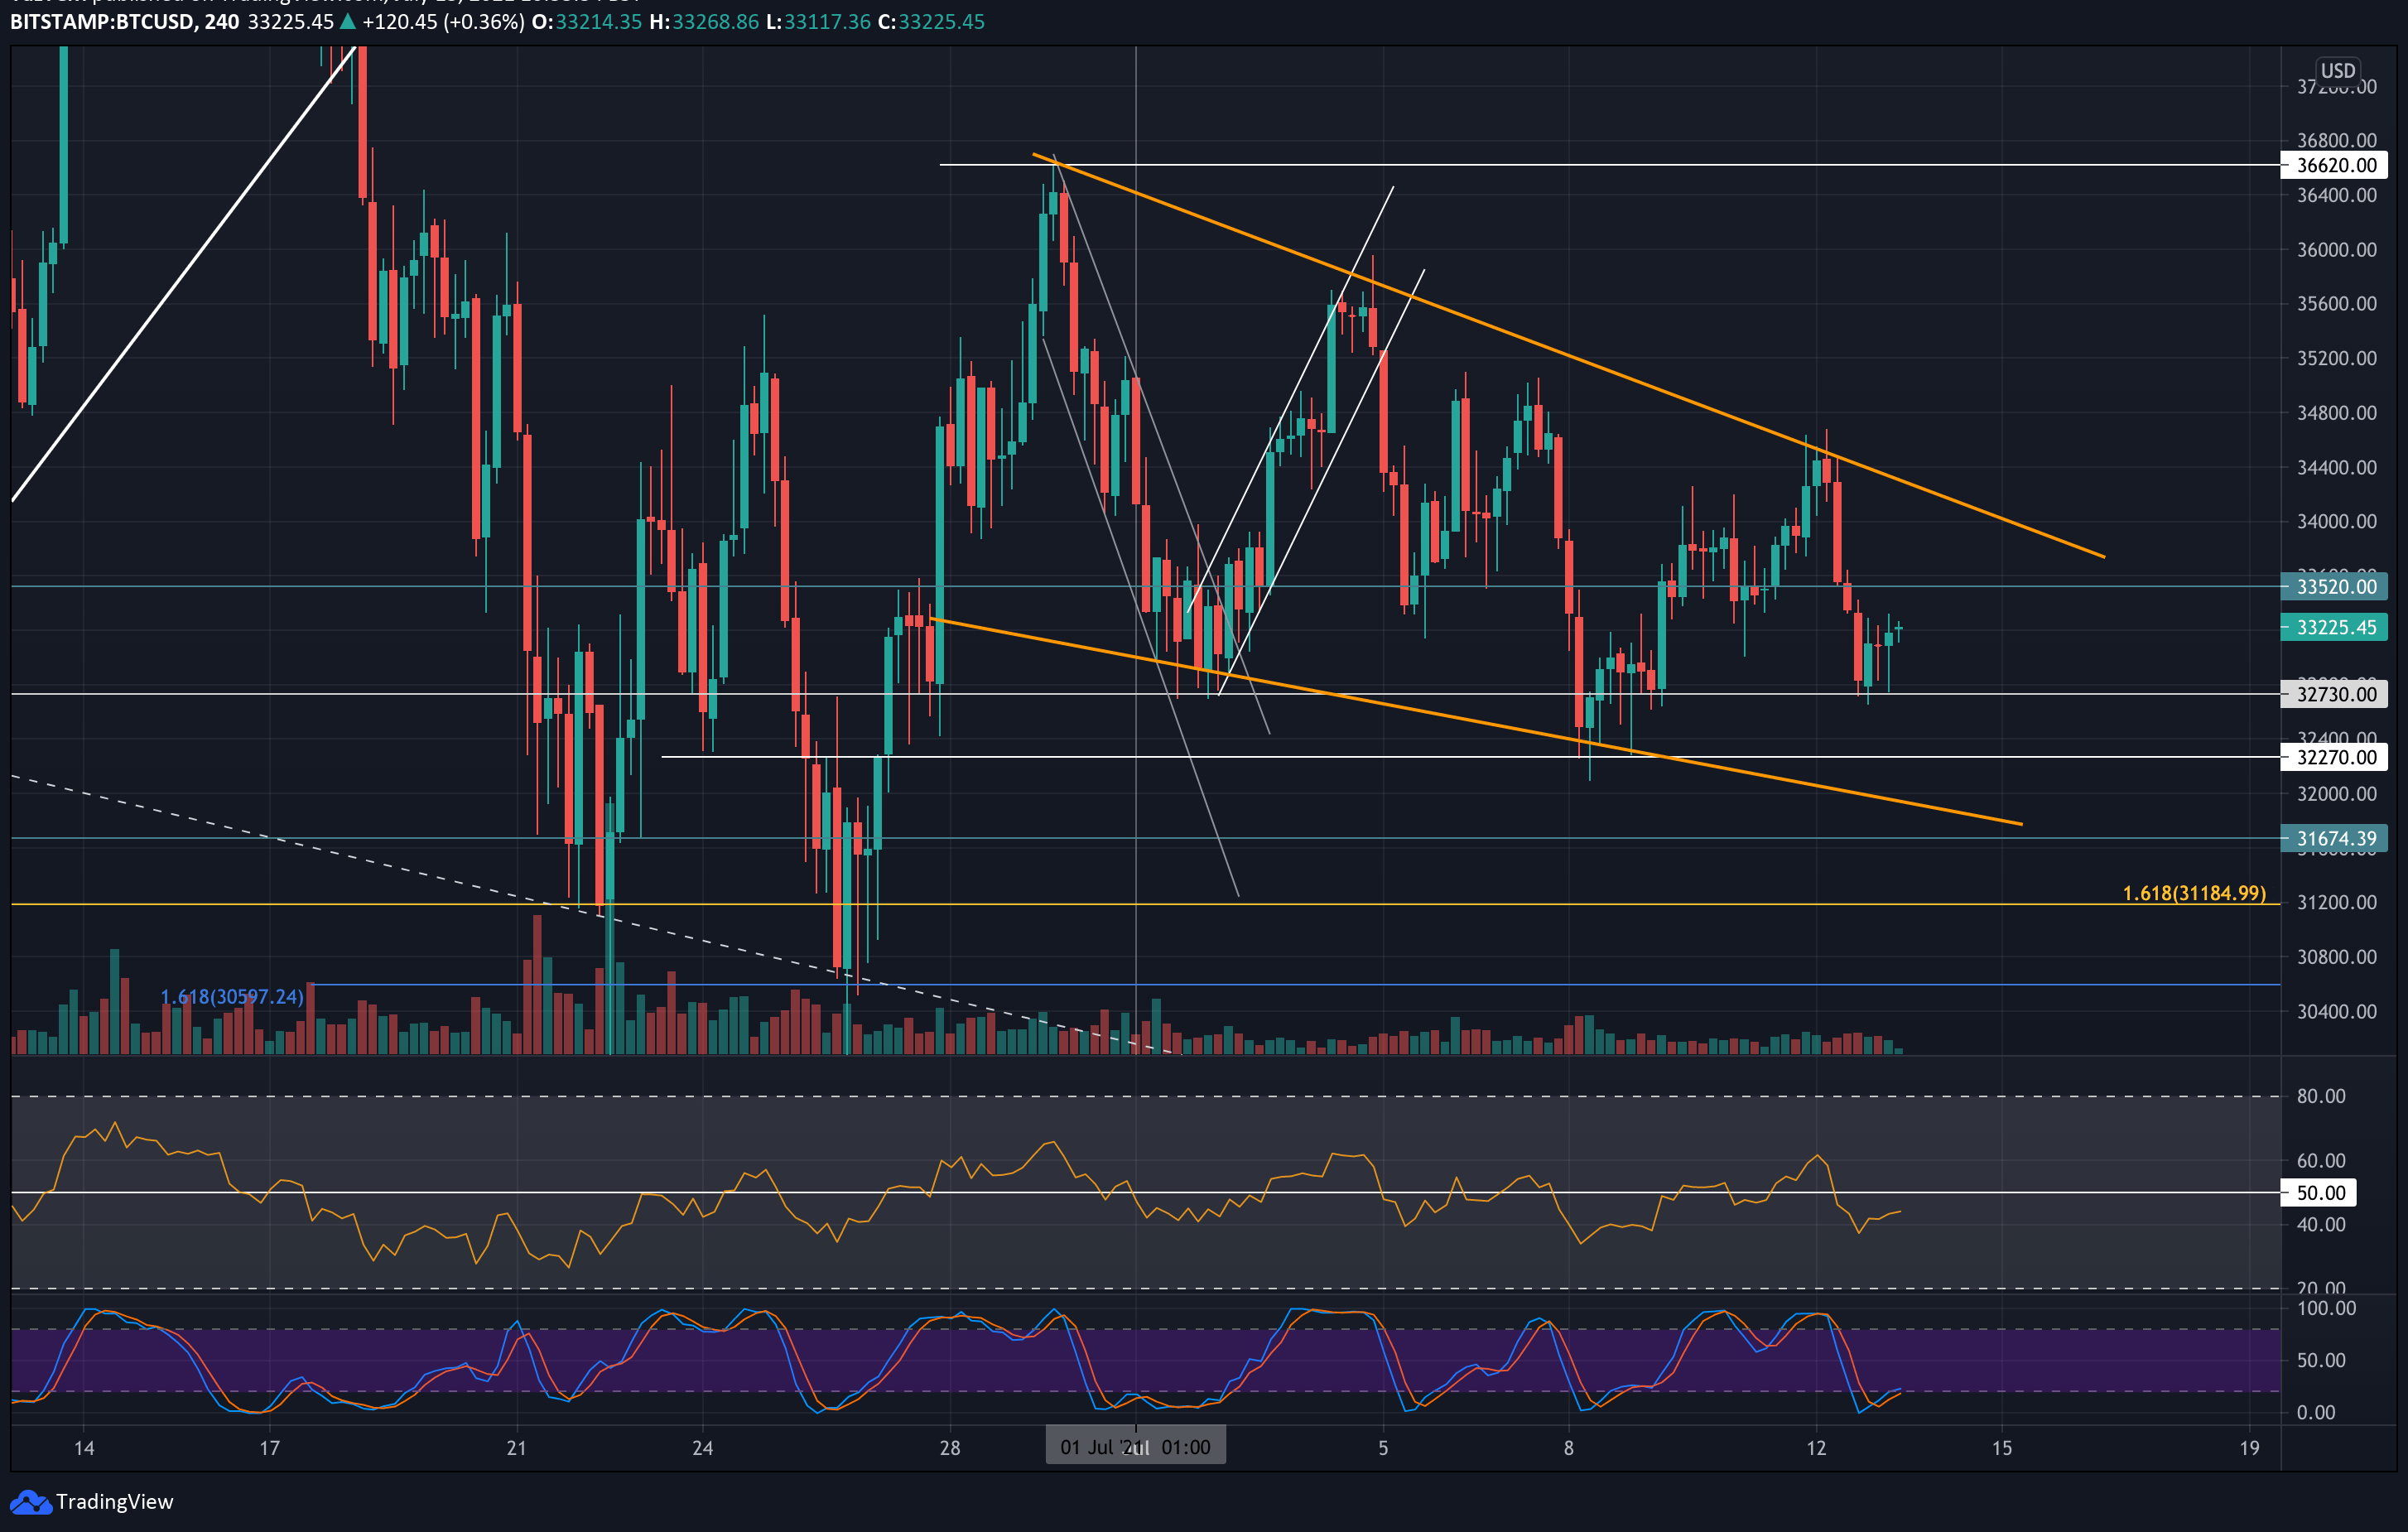
On the daily chart, a short-term descending price channel has emerged throughout July, reflecting the current market weakness. Additionally, a short-term falling wedge pattern is visible on the 4-hour chart, which could potentially develop into a bullish reversal pattern.
Looking ahead, the first key support lies at $32,700, which provided horizontal support in the first days of July. This is followed by support at $32,000, $31,500 (which corresponds to the lower angle of the wedge and late June’s double-bottom), $31,185 (downside 1.618 Fibonacci extension), $30,500, and $30,000.
On the resistance side, the initial level to watch is $33,500, where early July support turned into resistance. This is followed by resistance at $34,000 (20-day moving average and upper angle of the short-term wedge), $35,500 (50-day moving average), $36,600 (late-June resistance), $38,000, and $39,500.
The daily RSI remains beneath the midline, continuing to track a long-term descending trend line that has kept the momentum from forming higher highs since February. For Bitcoin to recover, it will need to break above this long-term trend line and end its bearish lower highs trajectory.