Ethereum’s price has declined after breaking below the 100-day moving average, reaching a pivotal support zone near $1.7K. This area may determine Ethereum’s next significant move as traders assess its price action and on-chain developments.
Daily Chart Overview
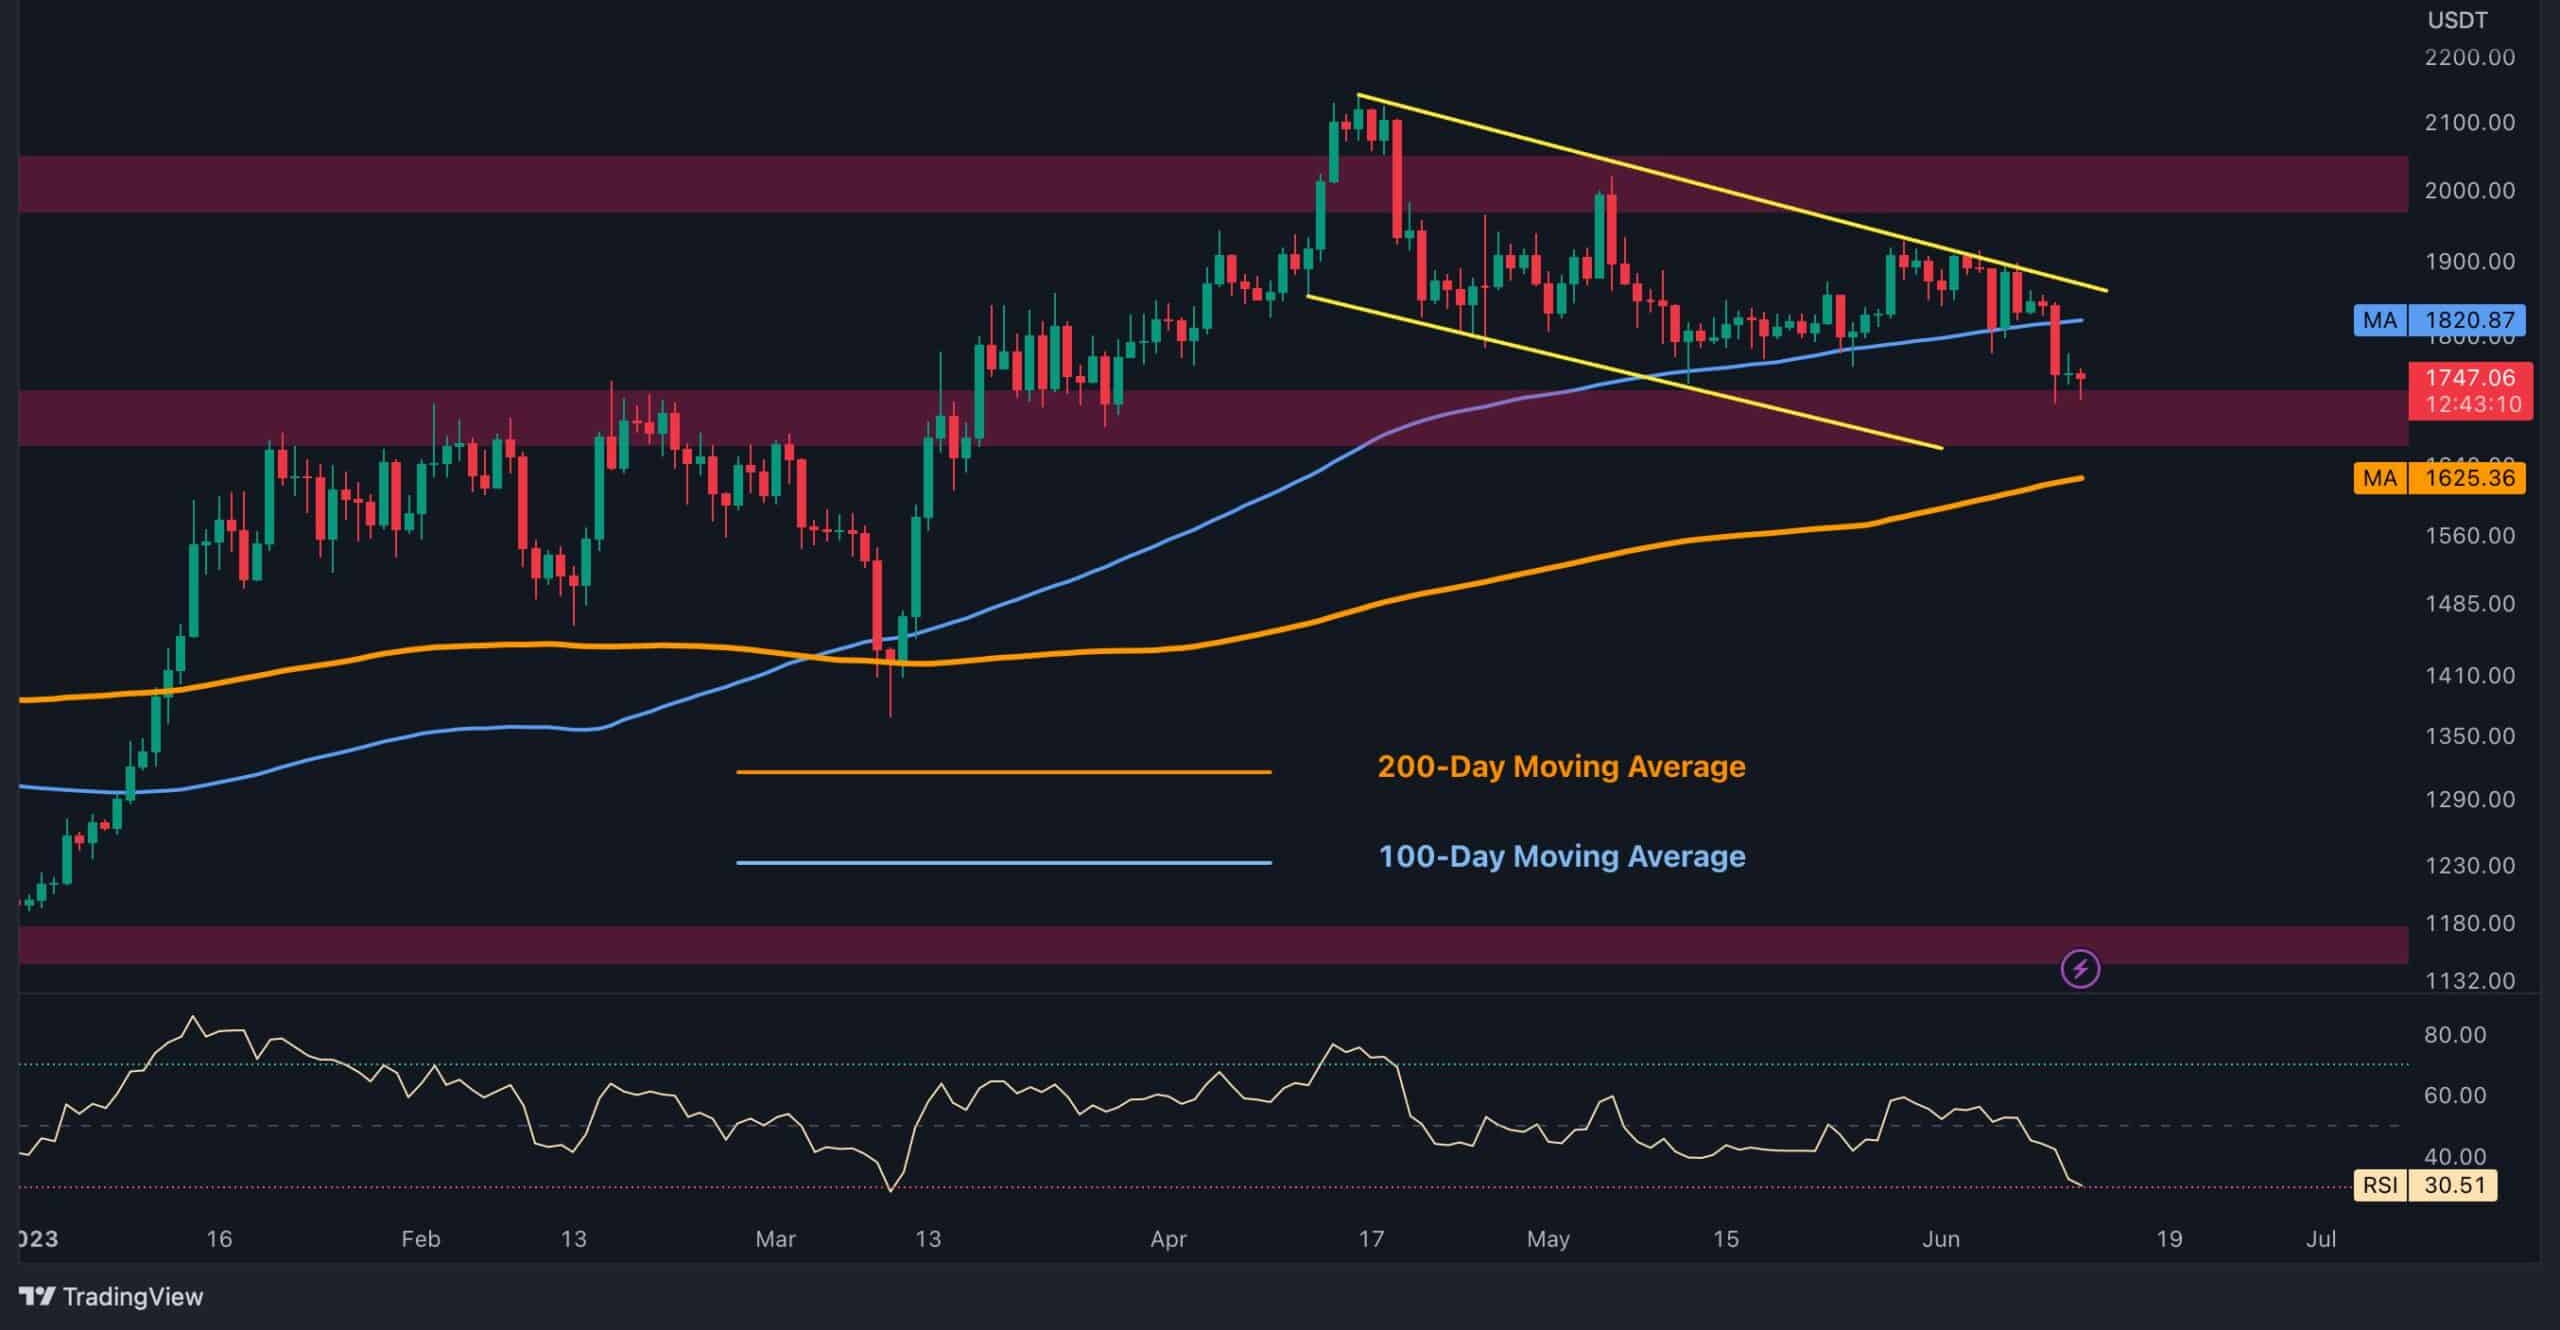
Ethereum’s recent breakdown below the 100-day moving average on June 10th has reinforced bearish sentiment in the mid-term. The price has now reached the $1.7K support region, a crucial level that has stabilized the downward momentum for the time being.
Should this support fail, the bears’ next target would likely be the 200-day moving average near $1,625. On the other hand, if this level holds, it could act as a foundation for a potential recovery.
4-Hour Chart Insights
The 4-hour chart reveals that Ethereum has dipped below the lower trendline of a previously established channel, landing at the $1.7K support zone. This level has held psychological importance since March 2023.
With the RSI indicator hovering around oversold levels, there is a chance for a temporary retracement towards the channel’s lower trendline. Alternatively, a successful defense of the $1.7K zone could trigger a bullish rally targeting the $2K resistance level.
Exchange Reserves Decline Amid Regulatory Uncertainty
The ongoing lawsuits filed by the SEC against Binance and Coinbase have intensified market fears, leading to significant outflows from both exchanges.
- Binance and its U.S. affiliate have experienced combined net outflows of approximately $1.43 billion worth of tokens on the Ethereum blockchain.
- Coinbase has similarly faced substantial withdrawals, reflecting the uncertainty among investors.
As a result, Ethereum’s exchange reserves on Binance and Coinbase have dropped significantly, highlighting the growing apprehension in the market. This reduction in reserves may have a dual impact: while it reflects fear, it also reduces the immediate selling pressure on exchanges, which could influence price stability.


