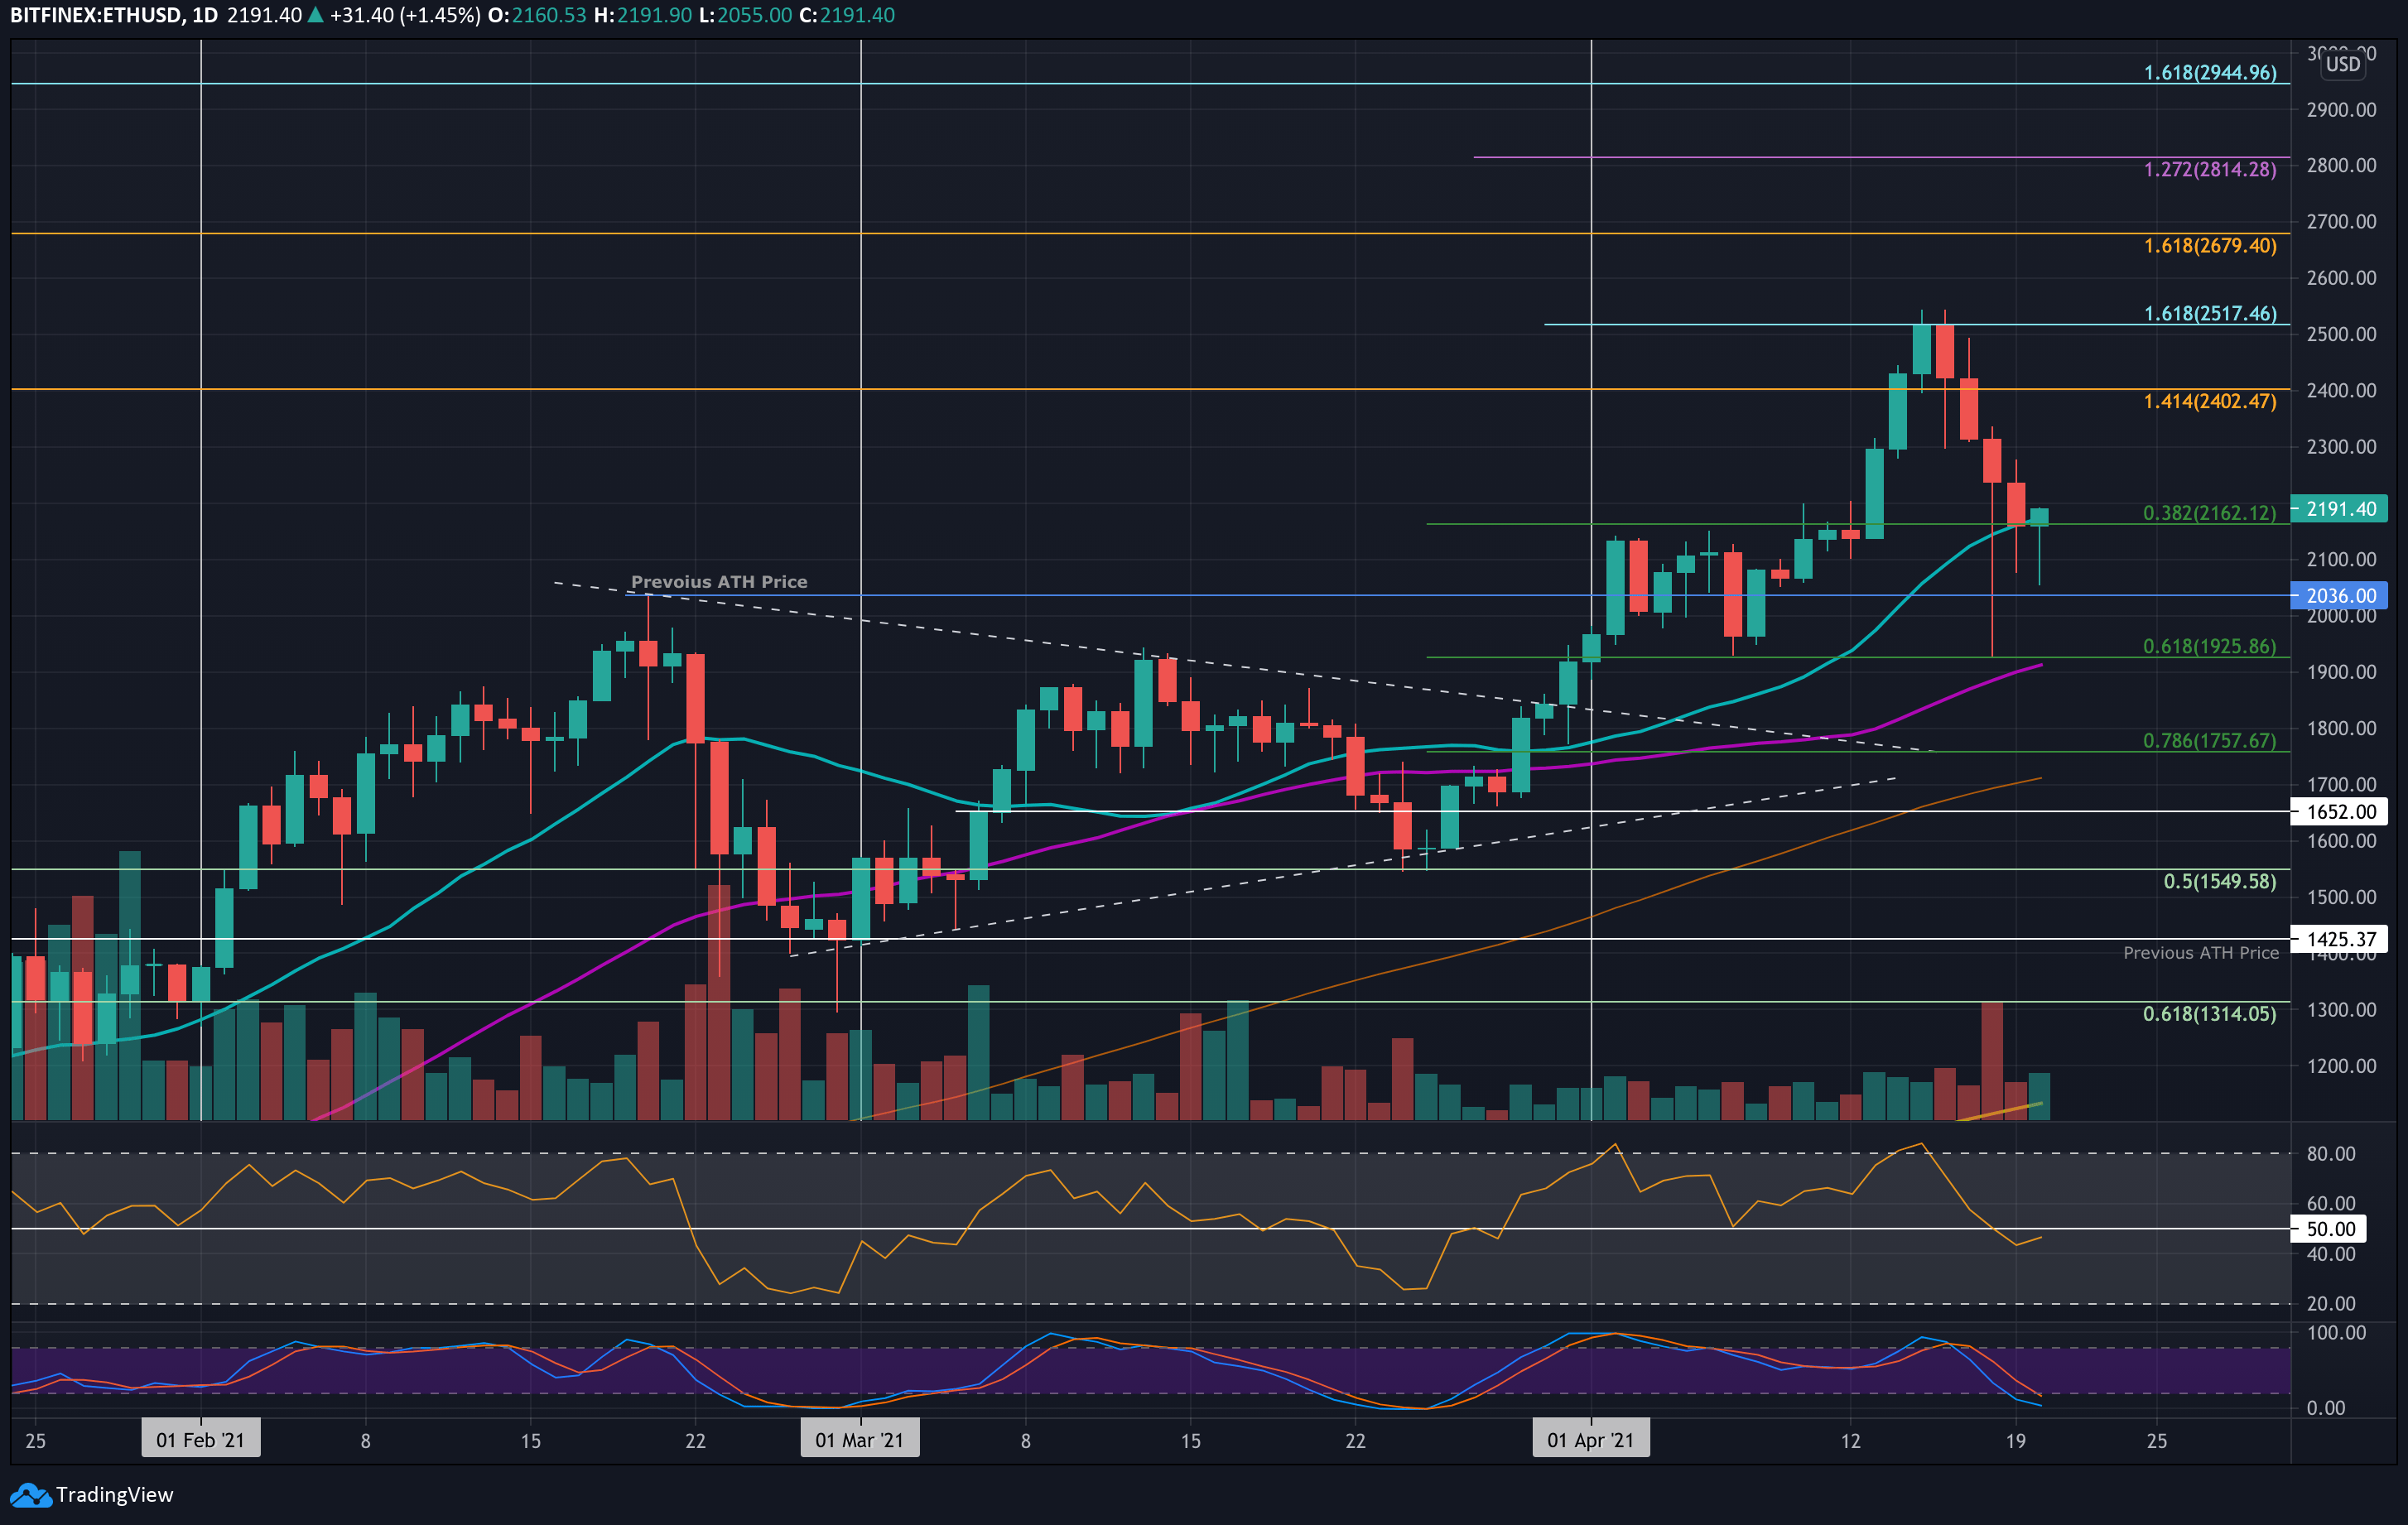
Ethereum has faced significant volatility recently, seeing a 14.5% drop from its recent highs of $2517. ETH initially encountered resistance at the 1.618 Fib Extension level, which led to a sharp decline. On Sunday, Ethereum fell to as low as $1925, finding support at the 0.618 Fib Retracement level. The recovery from this level allowed ETH to close the daily candle above $2200.
In the following days, ETH dropped again, but managed to find support at $2162, where it closed the daily candle, supported further by the 20-day moving average (MA). As of now, ETH is trying to maintain its position above $2162 and aims to push above the $2200 level.
- Support:
- The first key support lies at $2162, which is a confluence of the 0.382 Fib Retracement and the 20-day MA.
- If it fails to hold at this level, the next support lies at $2100, followed by $2000, and a potential dip to $1925 if the market continues its decline.
- Resistance:
- The first resistance level is at $2300, followed by $2400 (1.414 Fib Extension), and $2517 (1.618 Fib Extension).
- If Ethereum surpasses these resistance levels, it may test higher levels around $2600 and $2680 (1.618 Fib Extension).
RSI Analysis:
The RSI recently dipped beneath the 50 level, indicating a loss of bullish momentum. For the bulls to regain control, the RSI would need to climb back above 50 and show signs of recovery.
Ethereum has been performing relatively well against Bitcoin. It set a new 2021 high at 0.04 BTC last week but couldn’t push further. The flash crash on Sunday caused ETH to drop as low as 0.0366 BTC, but it quickly regained strength, closing the day near 0.04 BTC.
Over the past six days, Ethereum has established a solid trading range between 0.0385 BTC and 0.04 BTC. A closing candle outside of this range will likely set the direction for the next price move.
Short-Term Price Prediction:
- Support:
- If Ethereum falls, the first major support is at 0.0385 BTC, followed by 0.038 BTC and 0.037 BTC.
- The next support level is at 0.0361 BTC (March 2019 High) if the downtrend continues.
- Resistance:
- On the upside, the first resistance is at 0.04 BTC, followed by 0.0406 BTC (2020 High), 0.0416 BTC (2019 High), and 0.0425 BTC (bearish .786 Fib).
RSI Analysis:
The RSI is currently above 50, which is bullish, but it’s showing signs of divergence from the price action. This suggests that Ethereum might experience a price drop soon unless the RSI recovers and aligns with price action.


