Although experiencing a sharp decline today, XRP has seen a remarkable increase of nearly 50% in the past week. When measured against Bitcoin, XRP encountered significant resistance at approximately 2875 SAT, where it faced a bearish .618 Fibonacci level, before retracting to 2750 SAT today.
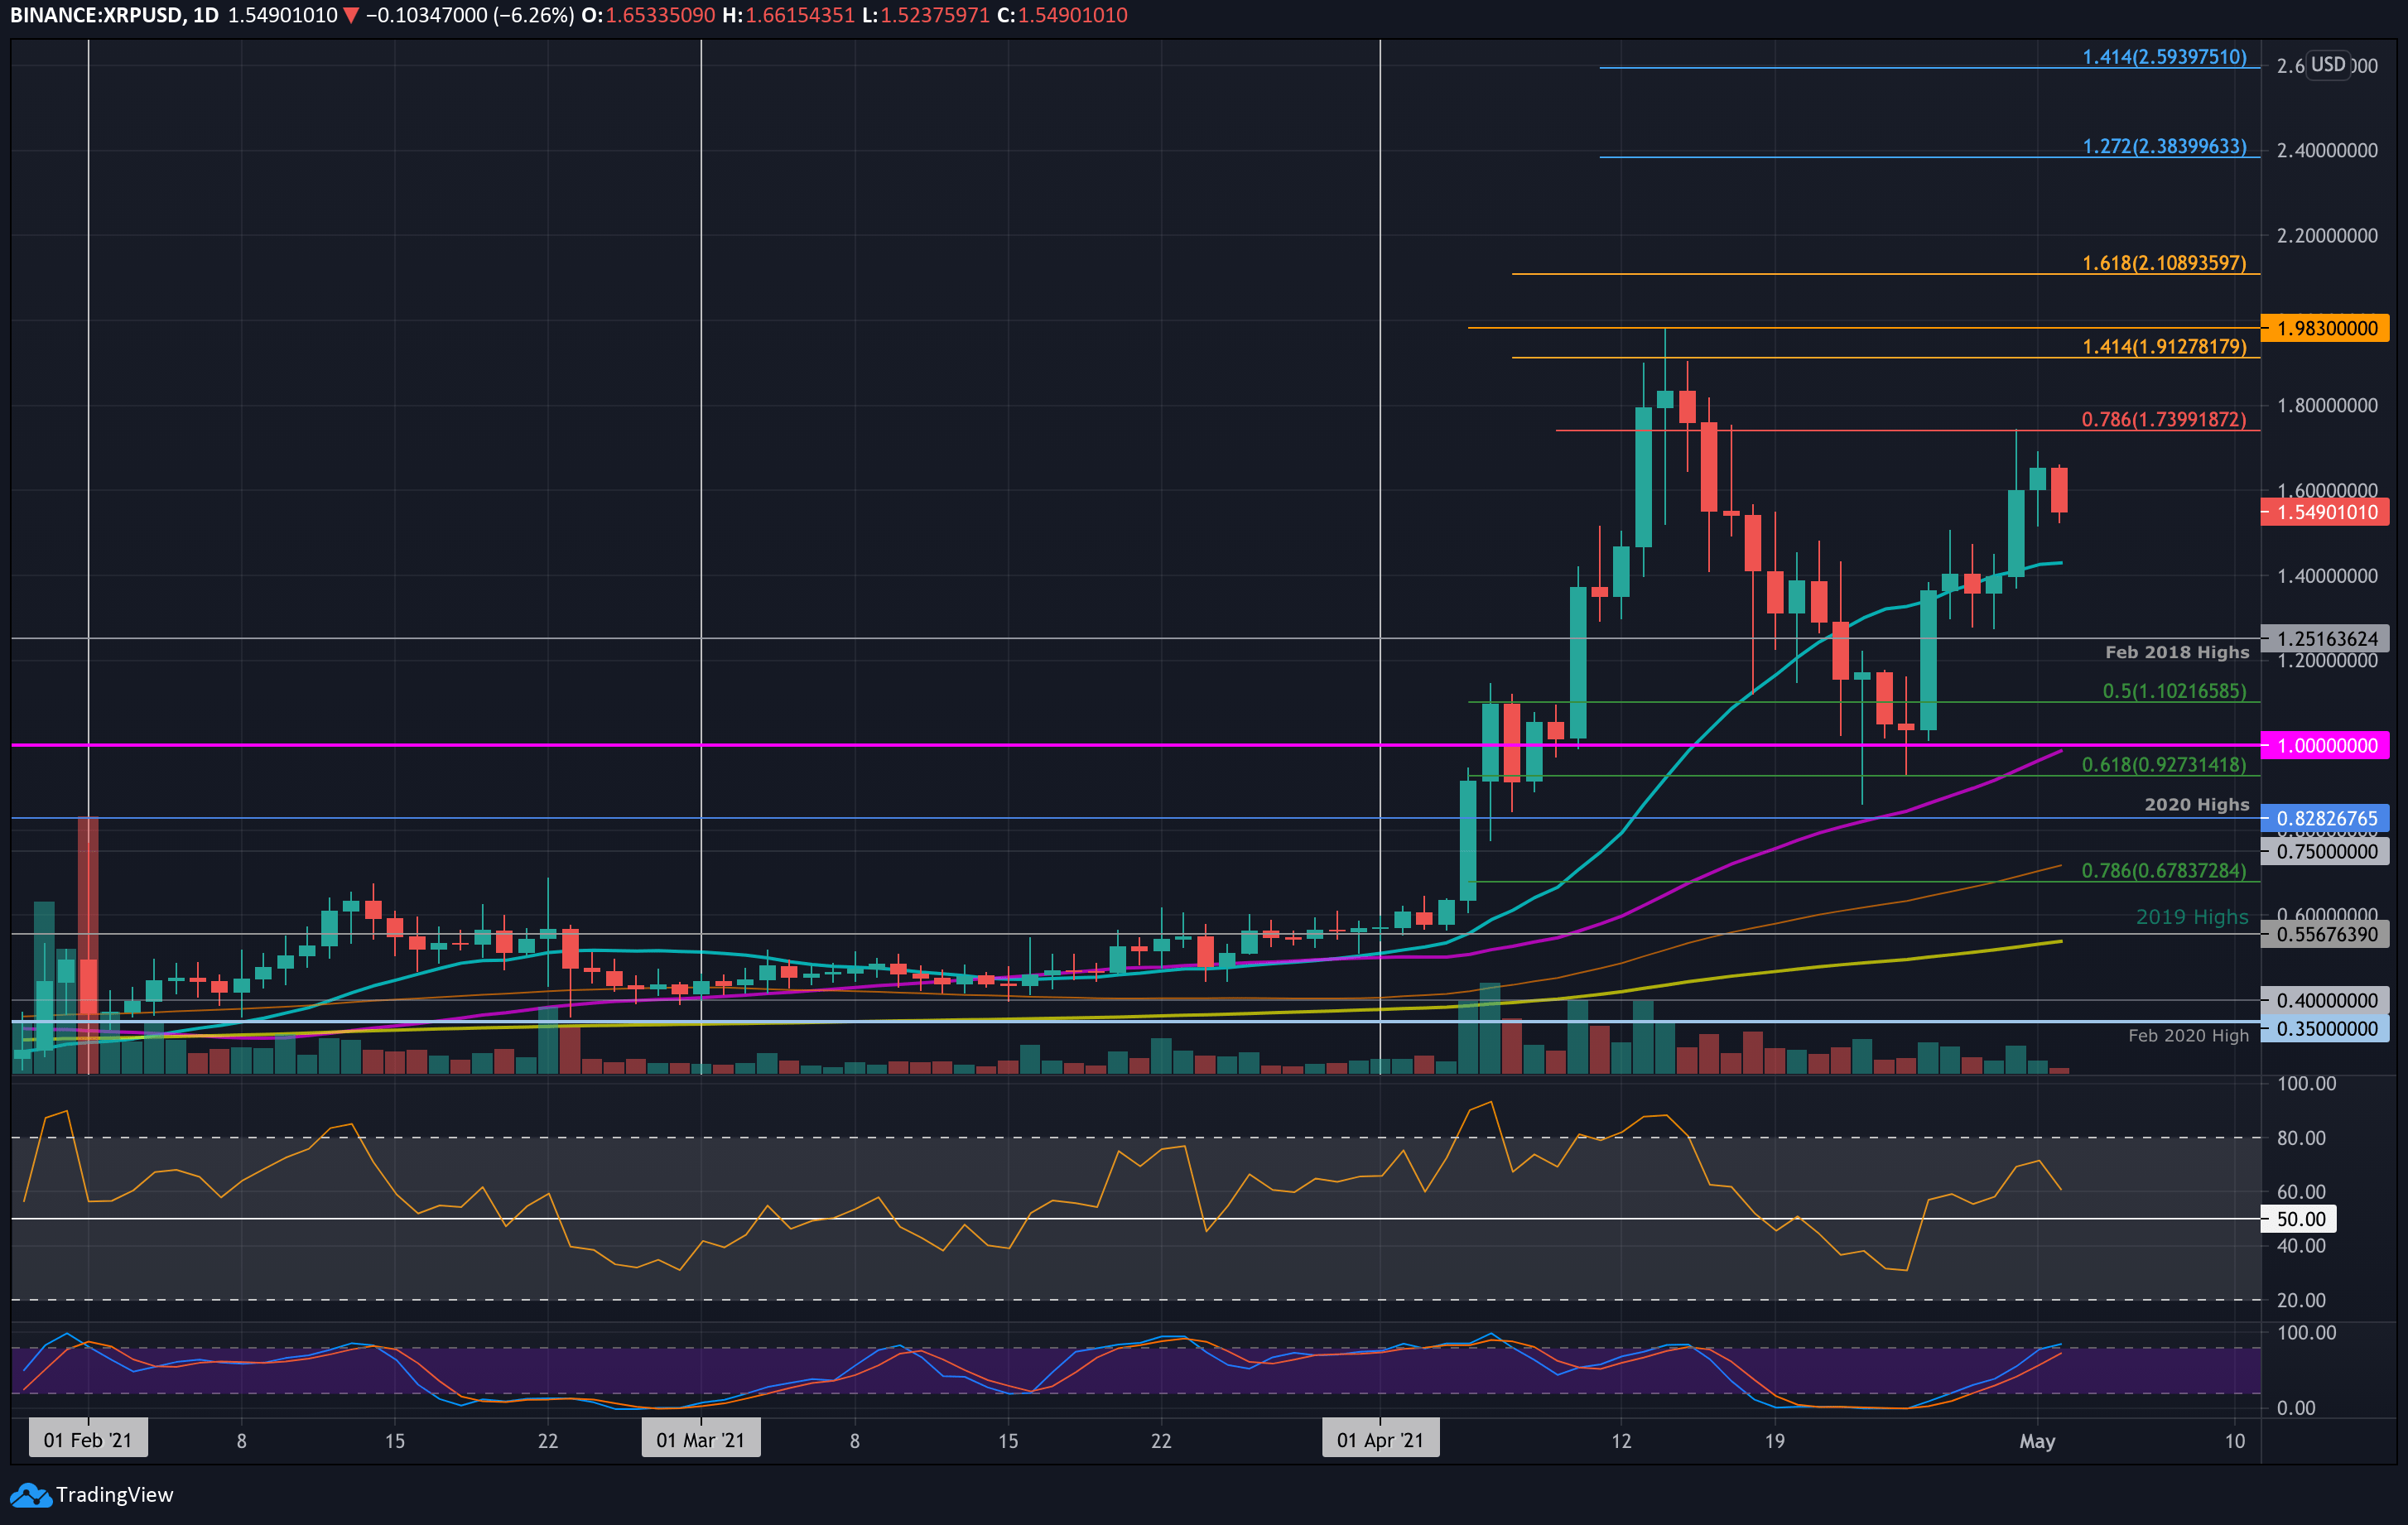
XRP showed impressive growth throughout this week, soaring by nearly 50%. XRP rebounded from the $1.00 level, peaking at $1.74 on Friday. At this point, it met resistance at a bearish .786 Fibonacci Retracement, triggering a significant price correction back to $1.5. This correction mirrors the broader downturn in the crypto market that began earlier this week.
The recovery from the $1.00 level allowed XRP to make an attempt at returning to the mid-April highs, where it briefly reached $1.98 — a level that has not been seen since January 2018. This resistance zone, along with the $2.00 level, represents the primary hurdles for XRP on its path toward reaching a new all-time high.
Looking ahead, the first notable support level for XRP is at $1.40 (20-day moving average). This is followed by $1.25 (February 2018 highs), $1.10 (50% Fibonacci retracement), and $1.00.
On the upside, the first resistance level is at $1.74 (bearish .786 Fibonacci retracement). Other significant resistance points are $1.98 / $2.00, $2.10 (1.618 Fibonacci extension), and $2.39 (1.272 Fibonacci extension).
The RSI currently stands above 60 but has shown signs of weakening, with the indicator beginning to dip. Despite this, bulls are likely to maintain control of the price action until the RSI drops below the midpoint.
XRP has performed well against Bitcoin, bouncing from the 2000 SAT level at the start of the week. This breakout allowed XRP to move above the 20-day moving average, leading to further price increases.
The bullish momentum continued throughout the week, enabling XRP to reach 3000 SAT on Friday. However, it was unable to close a daily candle above resistance at 2875 SAT (bearish .618 Fibonacci level) and has since retraced to the 2750 SAT mark.
For the near future, the first support level lies at 2530 SAT (20-day moving average), followed by 2225 SAT (.382 Fibonacci level), 2000 SAT, 1900 SAT (July 2020 low), and 1720 SAT (.618 Fibonacci retracement and 50-day moving average).
On the upside, the first resistance is at 2877 SAT (bearish .618 Fibonacci). Above this, resistance levels are found at 3000 SAT, 3058 SAT (April highs), 3360 SAT (February 2020 highs), and 3485 SAT (bearish .786 Fibonacci).
The RSI remains bullish, above 60, though it is beginning to dip, which suggests that the short-term upward momentum may be slowing.


