It has been 51 days since Ethereum dropped to a new yearly low of $1.1K, and since then, the price has been stuck in a consolidation range between $1.1K and $1.3K. This price action suggests that Ethereum is undergoing a phase of indecision, and the market is waiting for a clear breakout or breakdown. In the upcoming days, consolidation within this range seems to be the most likely scenario, but key technical levels indicate that a decisive move may be near.
Technical Analysis: Daily Chart Shows Tight Price Action
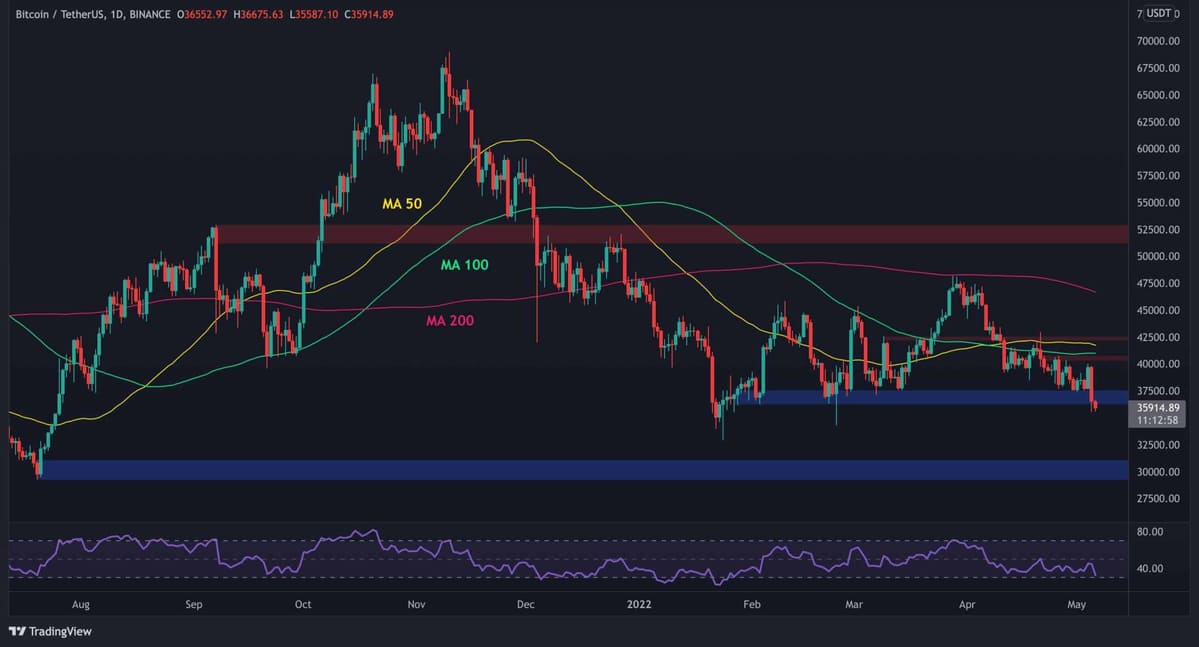
Ethereum faces a critical price zone, with the 50-day moving average acting as resistance at $1225 and the middle level of the multi-month channel providing support. The price must exit this tight range soon to determine the short-term direction. A breakout above the 50-day moving average could propel Ethereum toward the $1.3K resistance, while a drop below the middle boundary of the channel may trigger a price crash toward the lower support at $1.1K. This tight range indicates that Ethereum’s price could break in either direction, and the next move will likely define its trajectory.
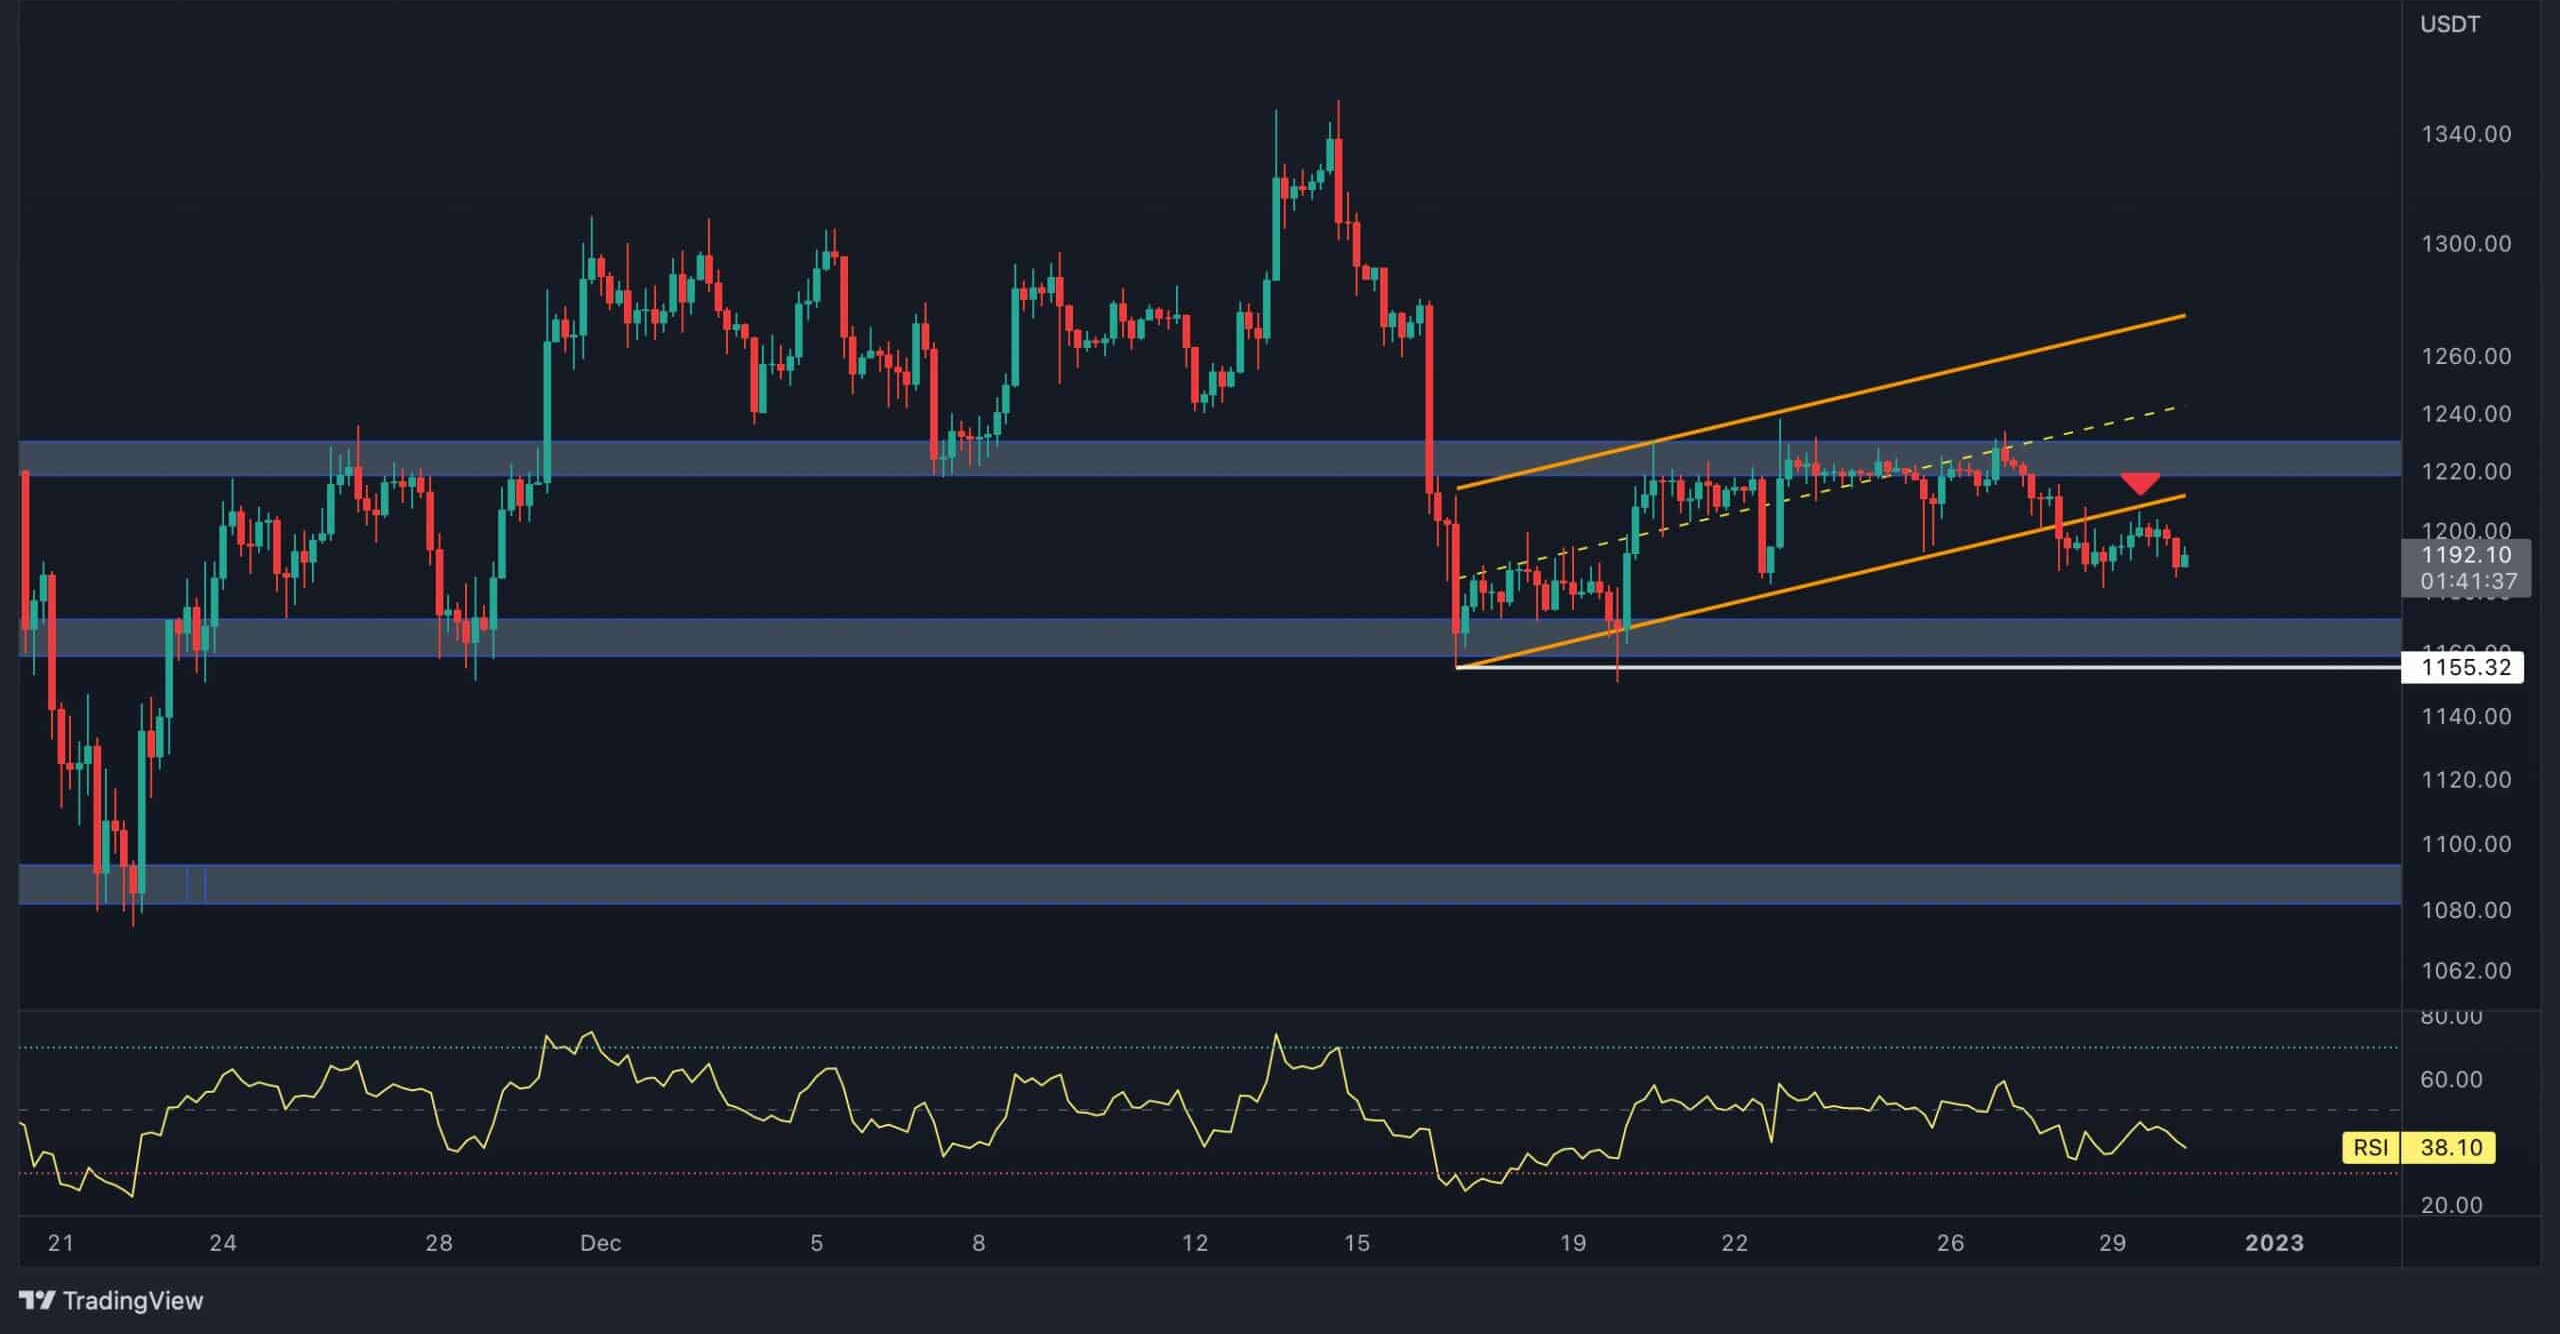
4-Hour Chart: Bearish Flag Breakout and Low Volatility
On the 4-hour chart, Ethereum has broken the continuation bearish flag pattern to the downside. After this breakdown, the price retested the broken level in the form of a pullback and is now consolidating with extremely low volatility. Ethereum is currently stuck between the $1230 resistance level and the $1160 support level, and further consolidation within this range appears to be the most likely scenario. If the price drops below $1160, the market will enter a new consolidation phase between the $1160 and $1100 levels. The lack of volatility and range-bound price action suggests that a breakout or breakdown may be imminent.
On-chain Analysis: Whales’ Activity and Potential Selling Pressure
On-chain data suggests that the whales and big players, who hold a significant portion of Ethereum’s supply, are influential in shaping the market. The Exchange Inflow Mean (7-day moving average) indicates the activity of large investors depositing substantial amounts of Ethereum into exchanges. A surge in this metric often suggests increased selling pressure. Prior to the major crash in November, this metric saw a sharp rise, indicating that large players may have distributed their assets, contributing to the price drop. However, the metric has since calmed down and decreased significantly, signaling a lack of activity in the market. While this may seem like a temporary calm, it could also signal a larger move in the near future.
Conclusion: Ethereum’s Path Is Uncertain, But Key Levels Must Be Watched
Ethereum is currently in a consolidation phase between $1.1K and $1.3K, with no clear direction emerging yet. The 50-day moving average and the multi-month channel’s middle boundary are critical levels that could dictate the next move. A breakout above $1.3K would signal a bullish trend, while a breakdown below $1.1K could lead to further declines. The lack of activity from whales suggests that the market could be preparing for a significant move, but it remains unclear whether this will result in a breakout or further price decline. Traders should closely monitor these key levels to anticipate Ethereum’s next move.