Ethereum’s price action has seen a brief surge above the middle boundary of its descending price channel, but momentum has recently slowed. ETH is now testing the $2,800 resistance level, which has become a crucial pivot for the market’s medium-term direction. Ethereum’s trajectory over the next few price movements will largely depend on whether buyers can maintain control and overcome the strong selling pressure currently limiting progress.
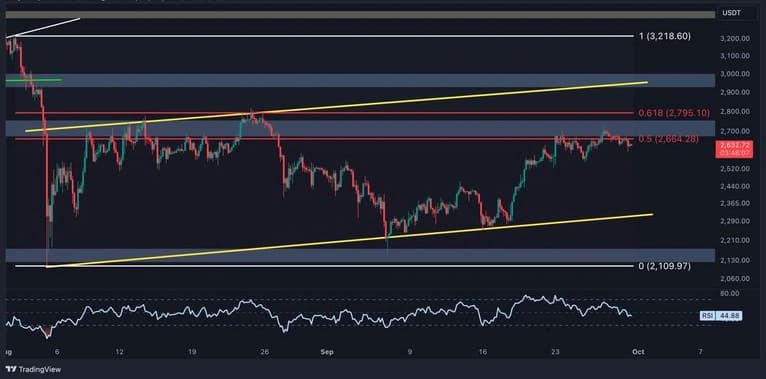
After pulling back from the middle of the descending price channel, Ethereum’s market activity diminished, leading to a phase of consolidation. This lack of volatility has allowed Ethereum to retrace slightly toward the $2.8K resistance level, a critical point where substantial selling pressure is likely concentrated. The price action around this level is pivotal. If Ethereum manages to break above the $2.8K resistance, it could signal a resumption of the uptrend, with a potential move towards $3,000. Conversely, if the price faces rejection here, Ethereum could consolidate further or even reverse, testing the $2.5K support level for additional buying interest.
Fibonacci Levels and Bearish Technical Signals
Ethereum’s recent price movements have encountered significant resistance around the 0.618 Fibonacci retracement zone at $2.8K. The formation of a three-drive pattern, a classic bearish signal, indicates that selling pressure is intensifying in this range. Historically, this price zone has been a strong resistance level, and if selling momentum prevails, Ethereum could experience a bearish retracement toward the lower boundary of its ascending flag pattern, which lies near $2.4K.
However, should buyers manage to break through the $2.8K resistance, the bullish trend would likely resume, with $3,000 serving as the next major target. This scenario would mark a breakout from the current range, validating the uptrend and setting the stage for further price appreciation.
On-Chain Analysis and Sentiment Shift
The Taker Buy/Sell Ratio, a key on-chain metric measuring market sentiment, provides further insight into the evolving market dynamics. The 30-day moving average of this ratio has remained below 1 for several months, indicating that sellers have been more aggressive and contributing to the overall market supply. However, recent upward movements in Ethereum’s price from the $2.1K support have been accompanied by a rebound in the Taker Buy/Sell Ratio. This shift suggests that buying interest is increasing, signaling a potential change in sentiment.
If the ratio continues to rise and approaches the 1 level, it could indicate that selling pressure is subsiding, which would further support the case for a rally. This shift in market sentiment could set the stage for Ethereum to push beyond its current resistance and continue its upward momentum.


