XRP experienced a 9% surge today, moving toward the $0.70 mark. Against Bitcoin, XRP is working to reclaim the 2000 SAT level as it begins to break above a descending trend line that has been in place since June.
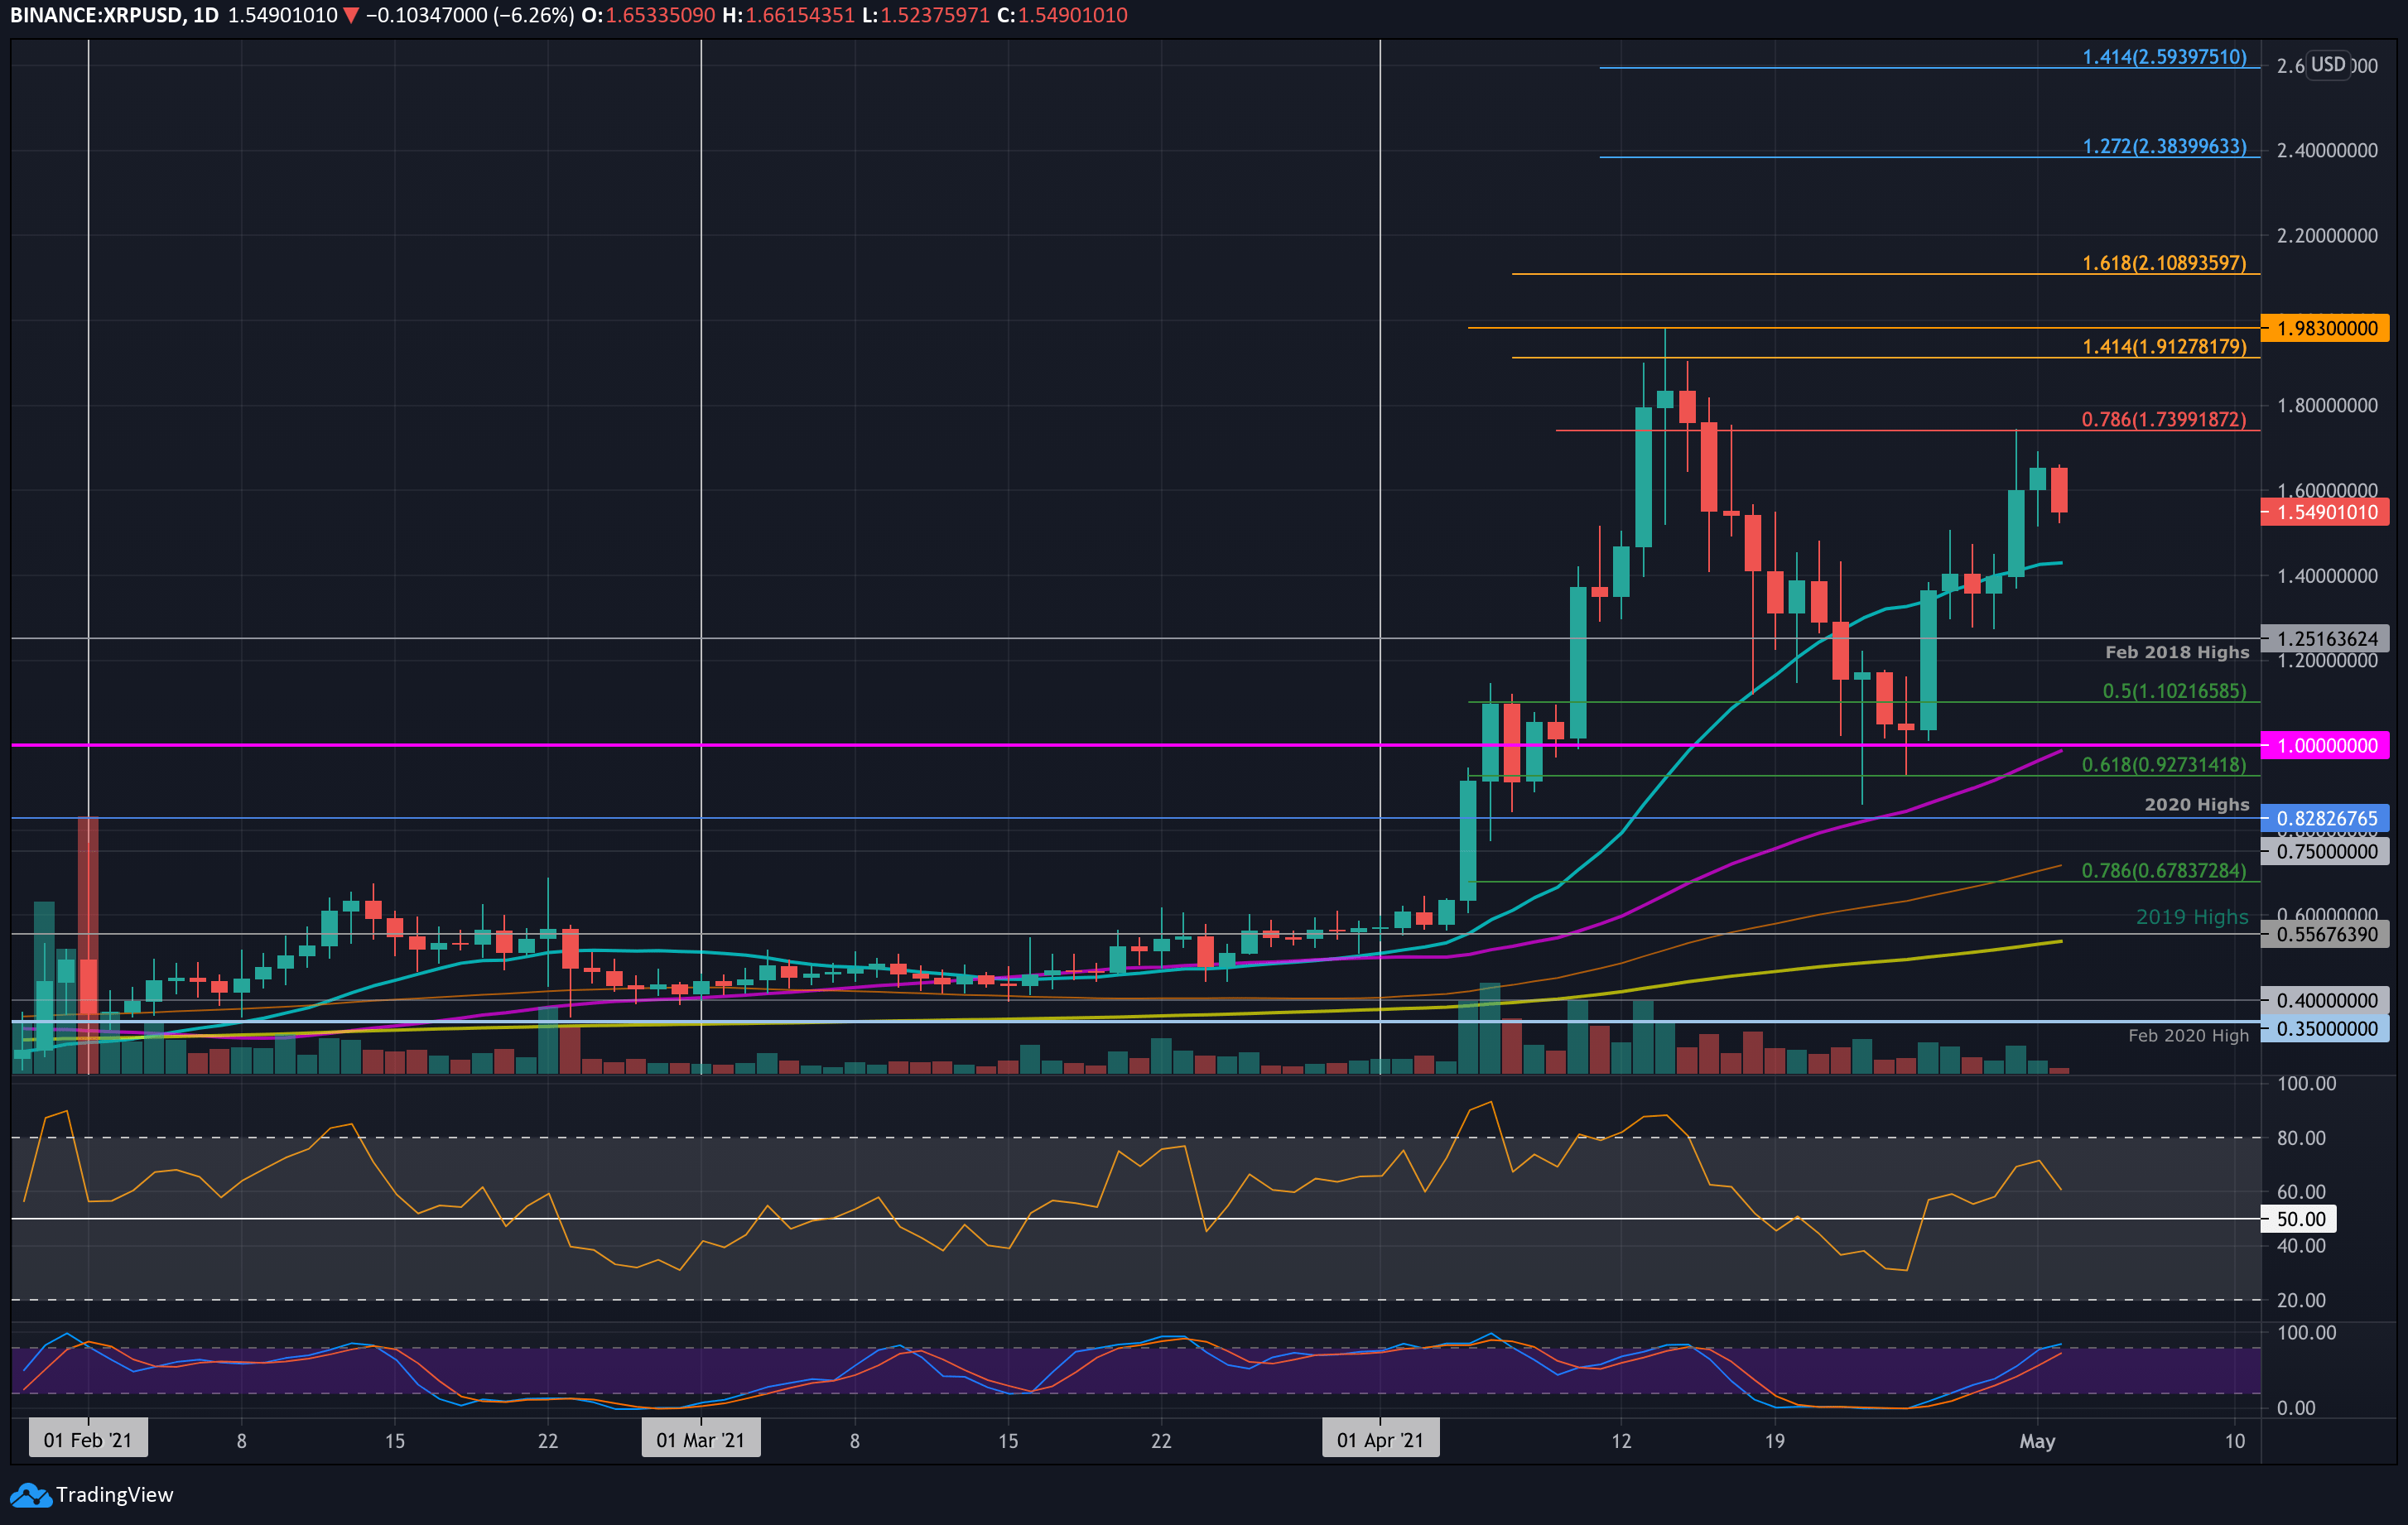
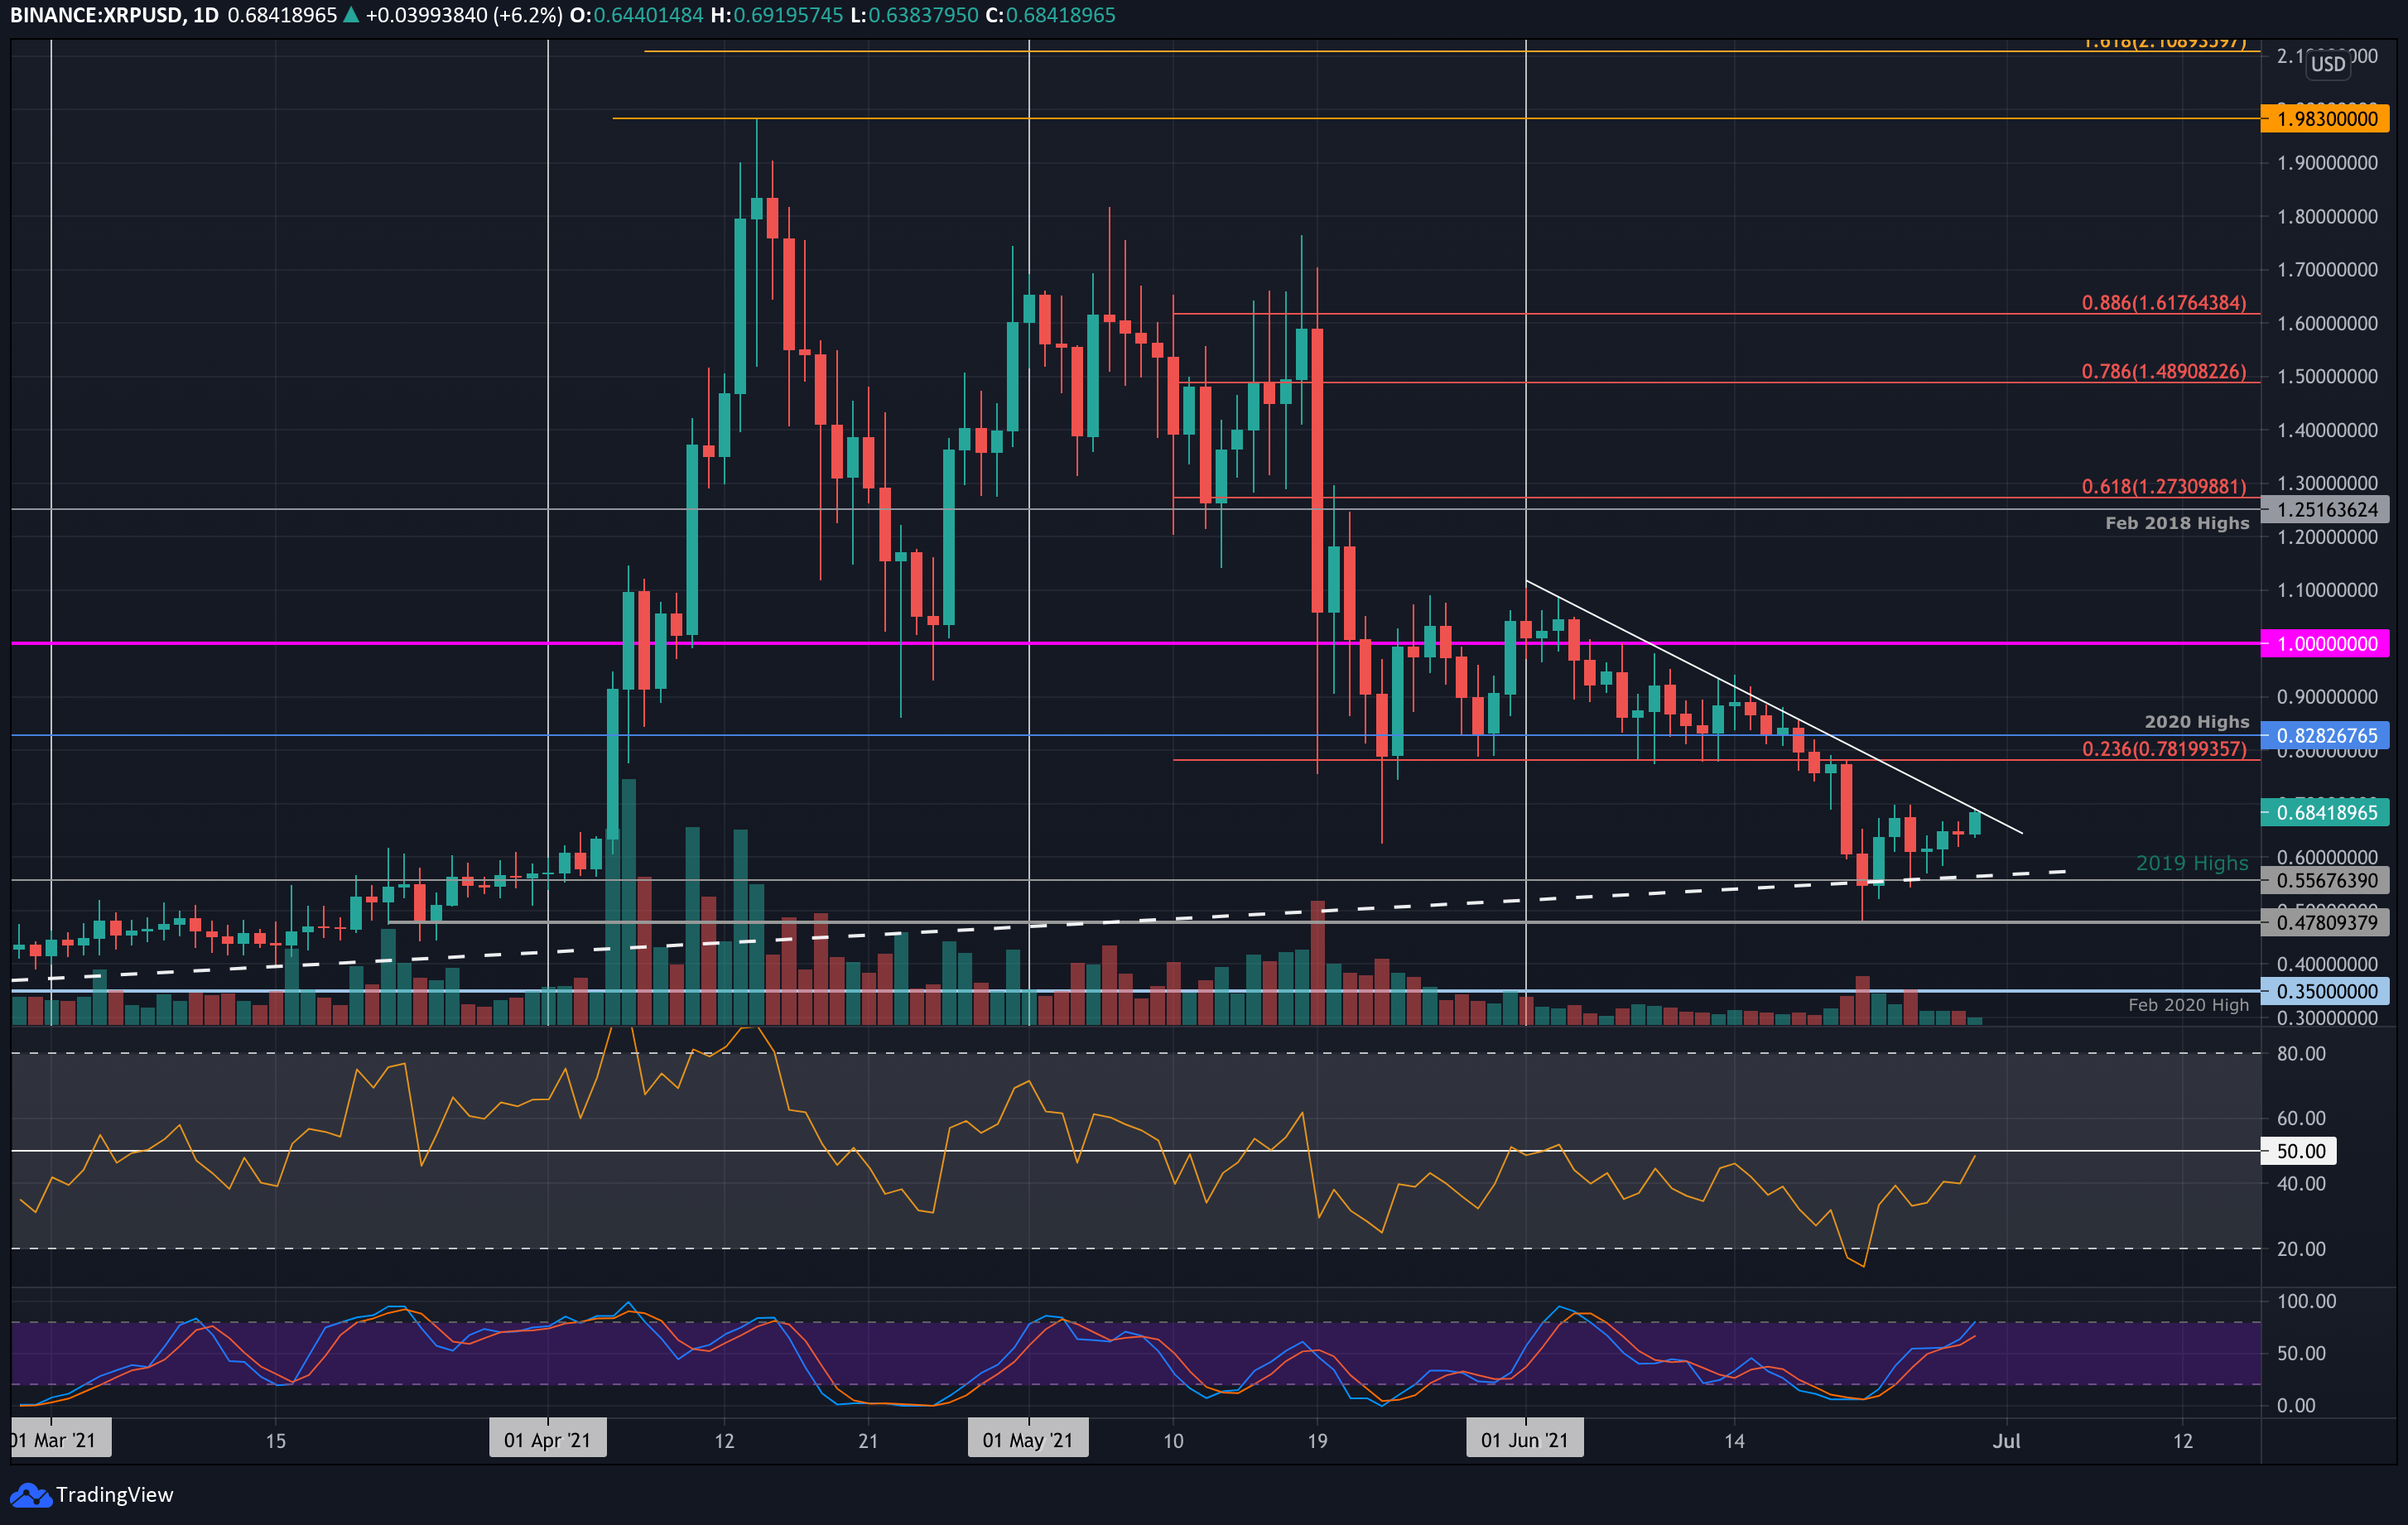
XRP found solid support at $0.56, a level that corresponds to the highs seen in 2019. Since then, it has made a recovery, finding additional support at $0.60.
For the past month, XRP has been confined beneath a descending trend line. The recent move towards $0.68 has brought XRP back to test this trend line. A breakout above this level could set the coin on a path toward the 2020 highs at $0.83, potentially pushing XRP back above $1.00 in the process.
Looking ahead, should XRP break above the trend line and surpass the $0.70 level, the first significant resistance will be at $0.78 (bearish .236 Fibonacci). This is followed by resistance at $0.83, $1.00, and $1.25 (February 2018 highs, along with a bearish .618 Fibonacci retracement).
On the downside, the first support lies at $0.60, followed by $0.56 (2019 highs), $0.50, $0.478, and $0.35.
The daily RSI is at the midline, signaling a state of indecision in the market. However, if the RSI breaks above this level, it could signal a shift toward bullish momentum, the first since the mid-May market decline.
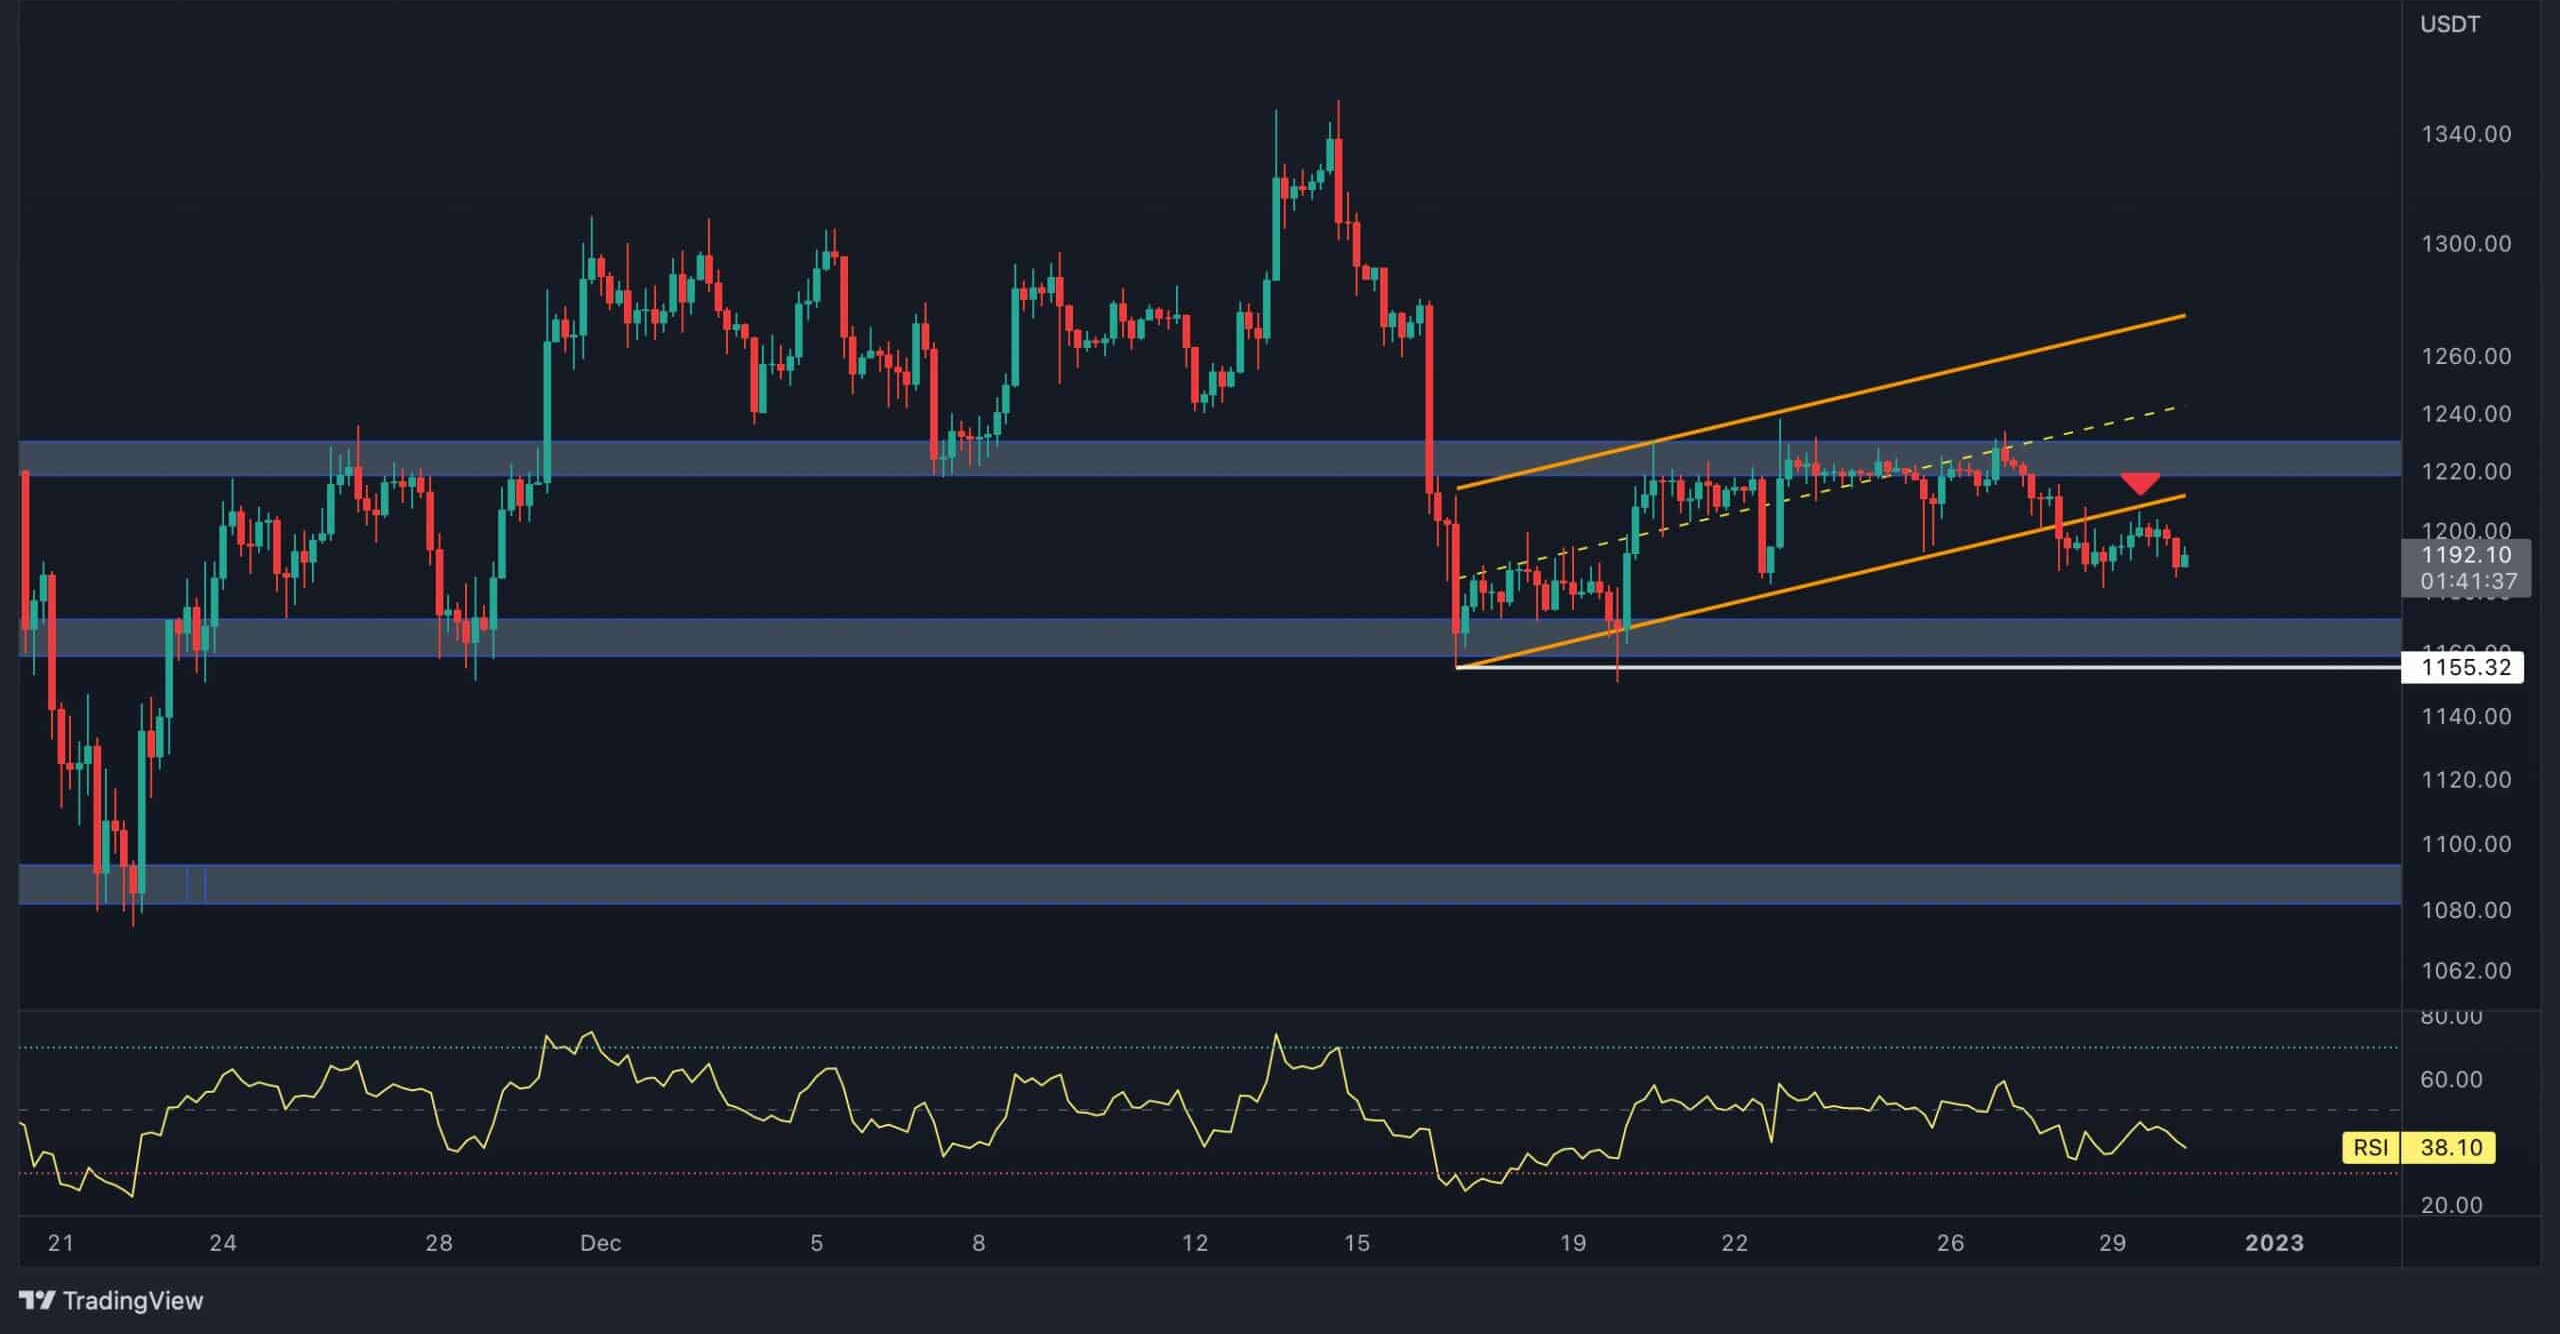
XRP has been trading beneath a descending trend line in the Bitcoin market for the month of June. Last week, the coin dropped to 1660 SAT, marking its lowest point since early April.
Since then, XRP has rebounded and is now trying to break above the trend line, attempting to end its downtrend from June.
Looking ahead, if XRP manages to break above the trend line, the first resistance level lies at 2000 SAT. This is followed by resistance at 2122 SAT (bearish .236 Fibonacci), 2425 SAT (bearish .382 Fibonacci), and 2670 SAT (bearish .5 Fibonacci).
On the downside, the first support lies at 1900 SAT, followed by 1800 SAT, 1660 SAT (downside .618 Fibonacci extension), 1550 SAT (November 2020 low), and 1365 SAT (bearish .786 Fibonacci).
The RSI in this market remains in bearish territory, staying beneath the 50 level. However, the indicator is showing signs of an upward move, suggesting that bearish momentum may be weakening.