
Polkadot’s Market Dynamics: What the Descending Wedge and RSI Divergence Imply for the Medium-Term Outlook
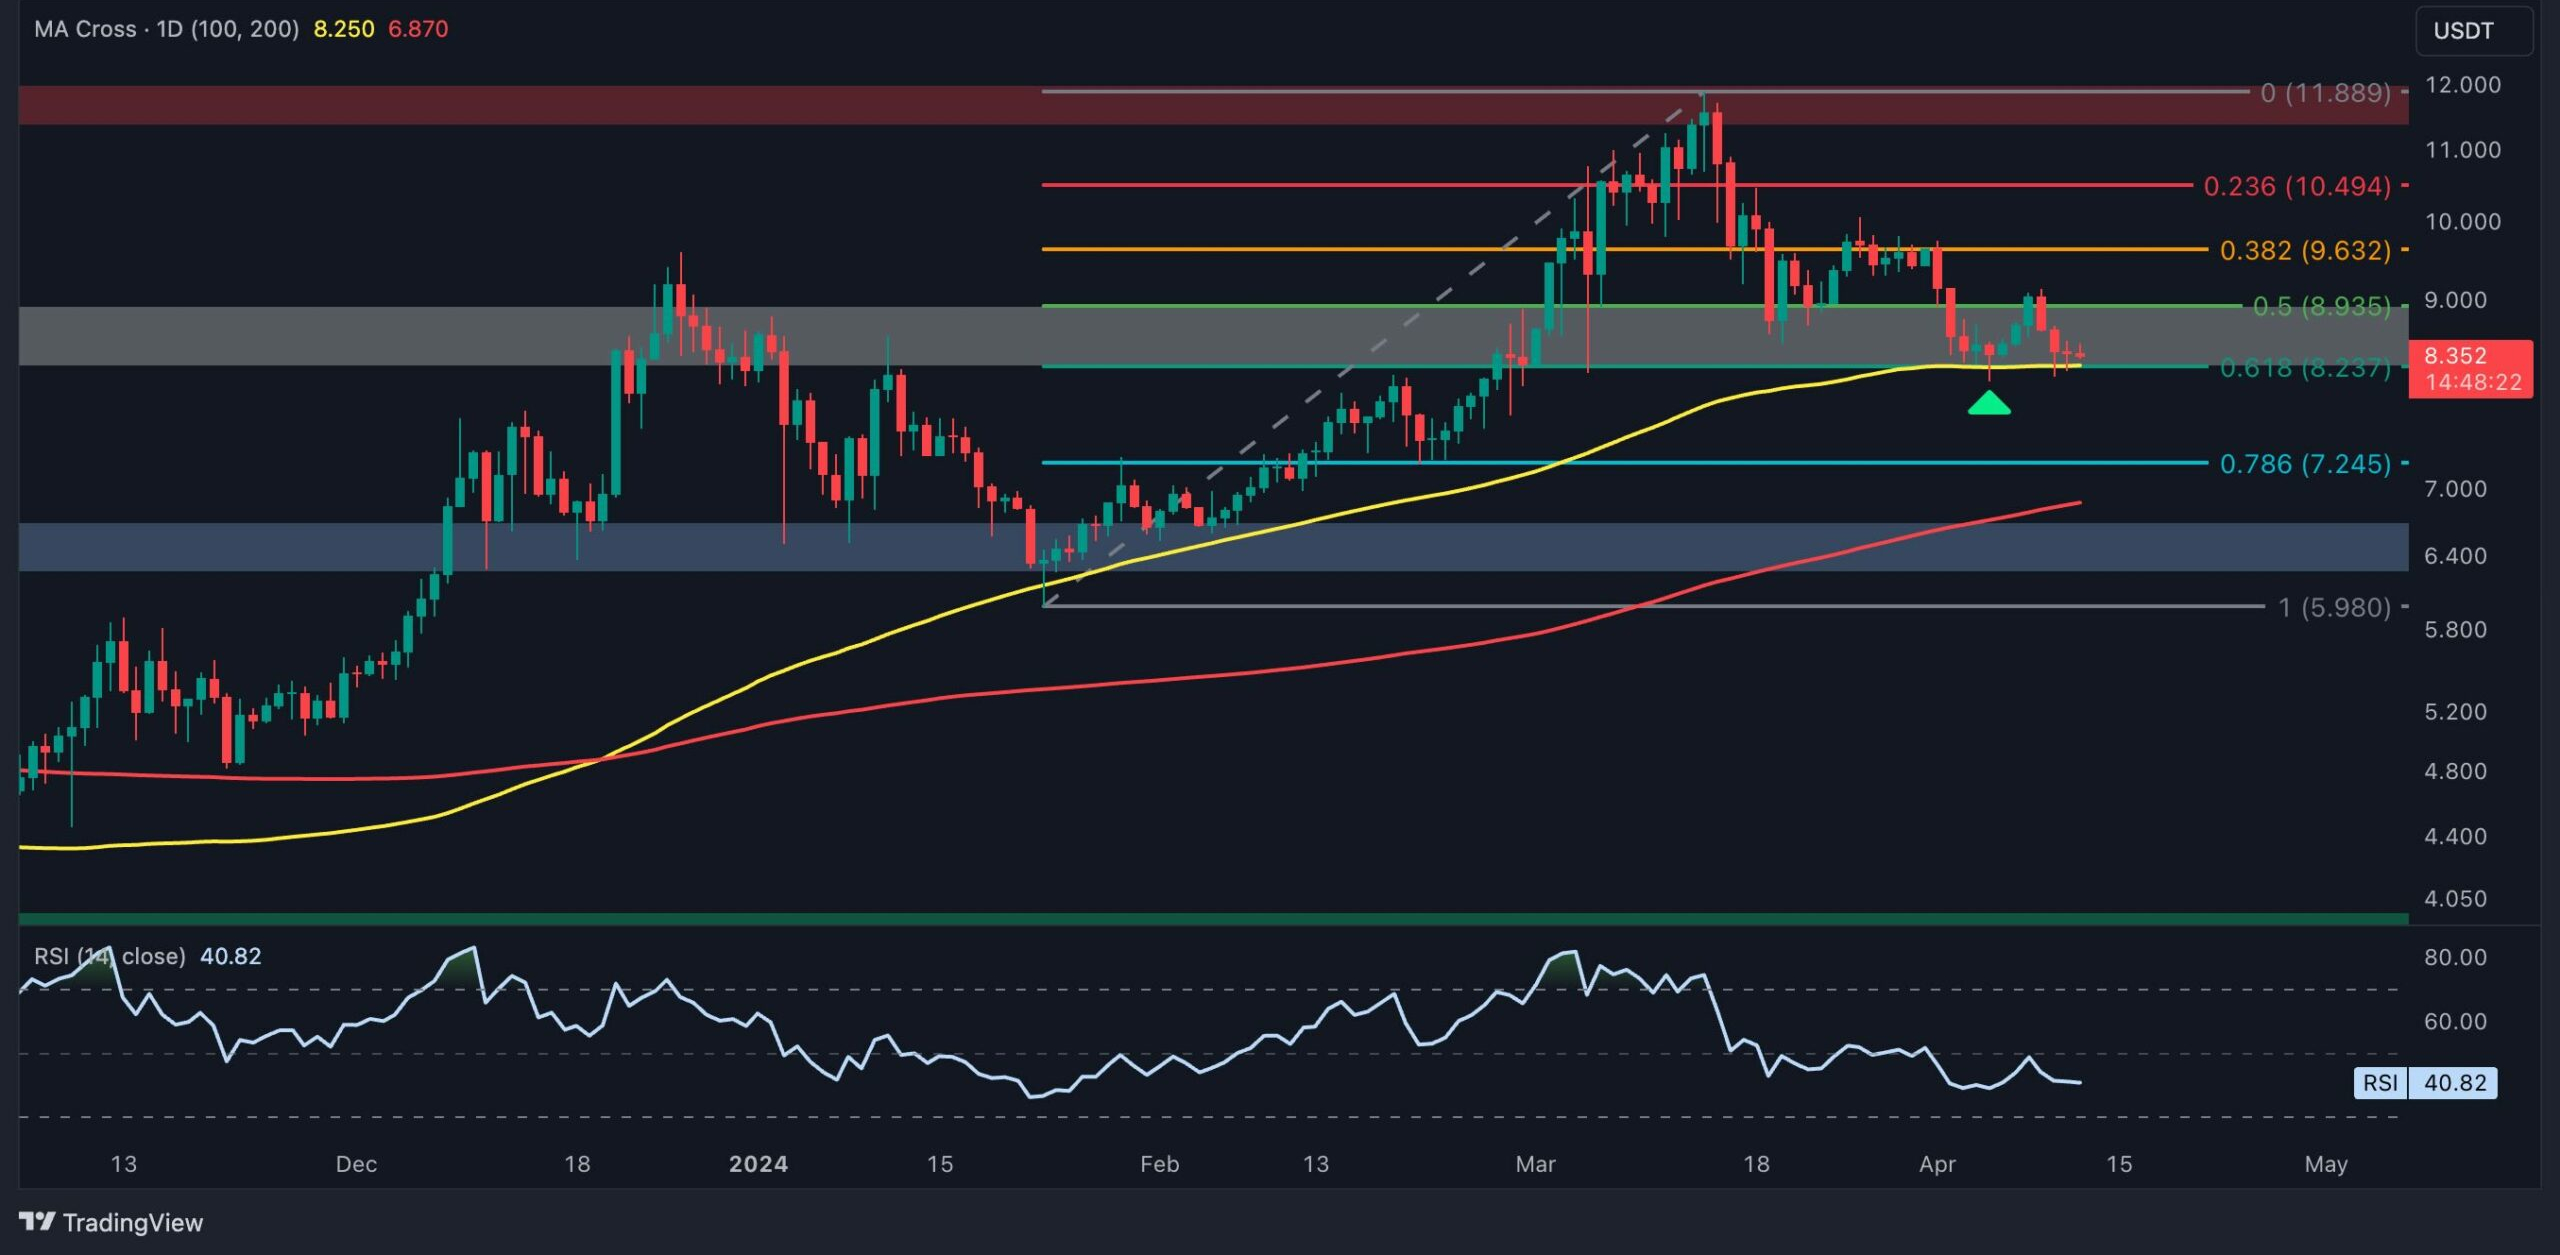
Polkadot’s daily chart reveals that the asset has experienced a notable 30% correction from its peak of $11.9. Despite strong support from the 100-day moving average and Fibonacci retracement levels, the price has not shown significant signs of a sustainable recovery. The support zone around $8 has temporarily held, but…