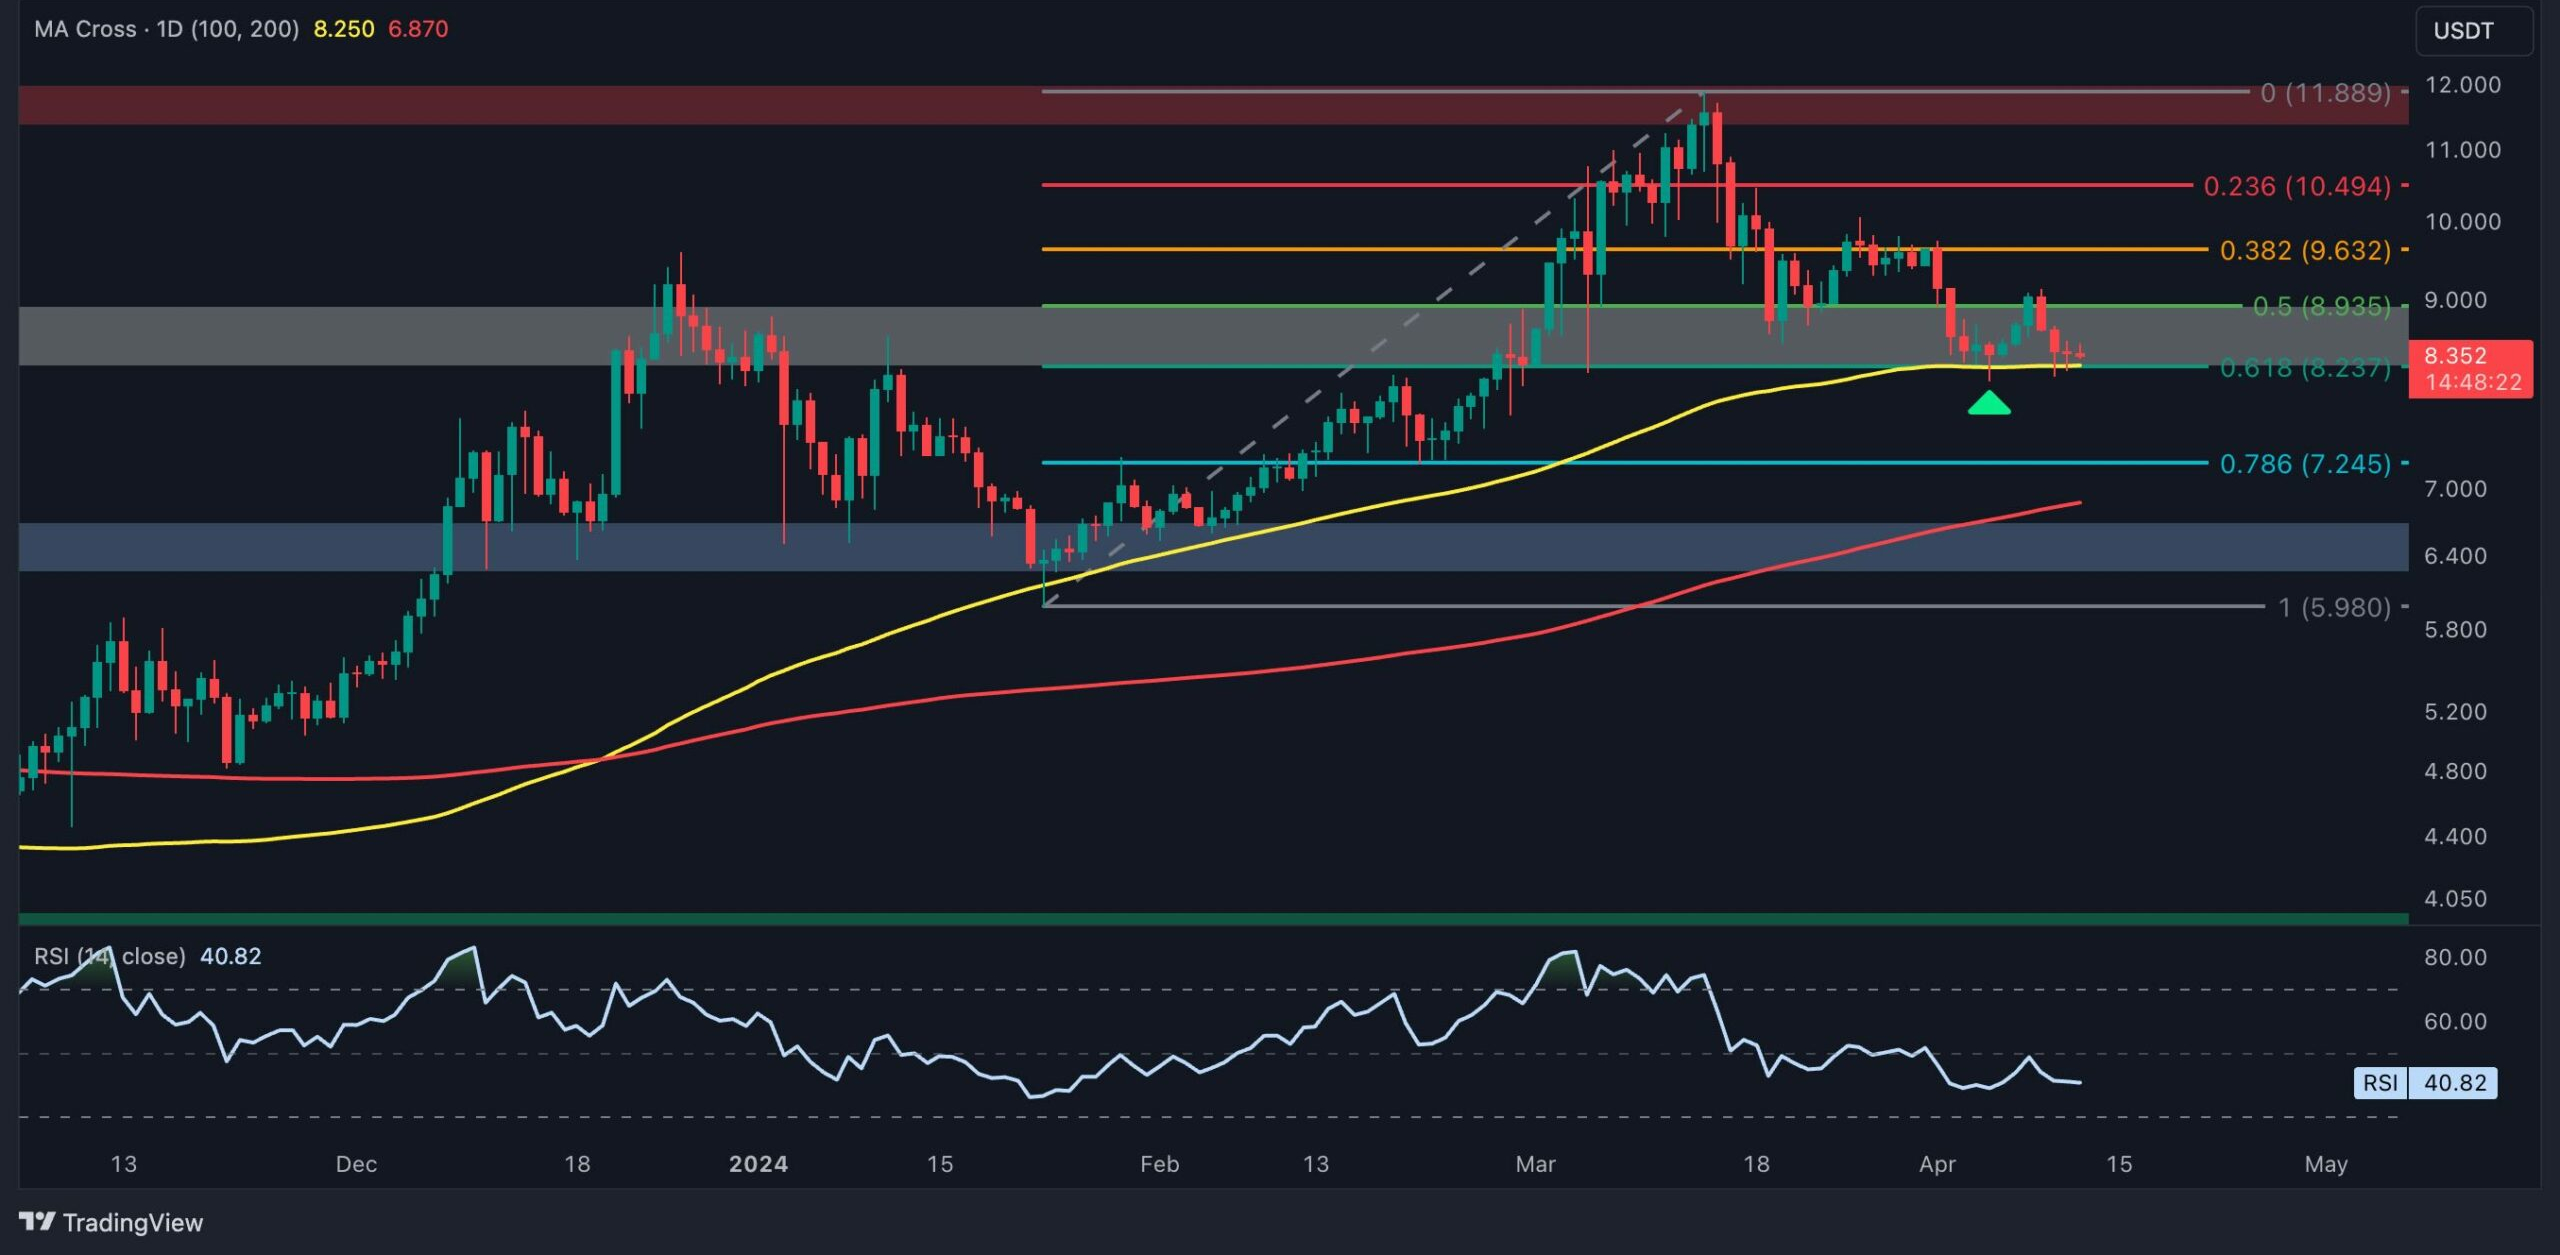
Polkadot’s daily chart reveals that the asset has experienced a notable 30% correction from its peak of $11.9. Despite strong support from the 100-day moving average and Fibonacci retracement levels, the price has not shown significant signs of a sustainable recovery. The support zone around $8 has temporarily held, but the broader market sentiment and lack of strong buying interest suggest that the price may face continued downward pressure.
Descending Wedge and RSI Bullish Divergence on the 4-Hour Chart
On the 4-hour chart, Polkadot found support near the $8 mark, leading to a brief consolidation. However, this consolidation was not accompanied by a strong rebound. The descending wedge pattern has failed to deliver the expected bullish resurgence, and the bullish divergence in the RSI is not sufficient to counteract the prevailing selling pressure. As a result, Polkadot has continued to face downward movement and has not yet managed to break above key resistance levels like $10.
Futures Market Analysis and Sentiment
The 30% decline from Polkadot’s yearly high of $11.9 has left the futures market cautious, with declining funding rates indicating a cooling of bullish sentiment. While positive funding rates had previously signaled some optimism, the steady decline in these rates, combined with the price drop, points to a weakening market structure. The overall sentiment has shifted towards caution, and it appears that Polkadot is facing an extended period of consolidation or further decline rather than a strong reversal.