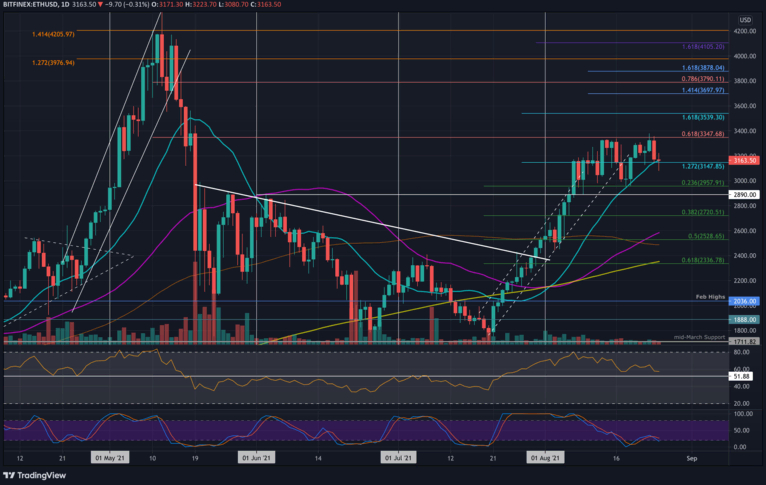
Ethereum experienced a significant pullback after failing to break above the key resistance at $3350, which is highlighted by the .618 Fibonacci retracement. This level capped Ethereum’s bullish momentum last week. After testing the resistance for the second time, Ethereum lost more than $170 in under 24 hours, breaking below the 20-day moving average (MA) at $3150. It reached as low as $3080, marking the lowest point in the past six days.
Currently, Ethereum is attempting to reclaim the 20-day MA as support. If it can close a daily candle above this level, it might prevent further declines. However, the situation remains fragile as the price faces increasing bearish pressure.
In the short term, Ethereum faces immediate support at $3150, which aligns with the 20-day MA. If this level is broken, further support is expected at $3080, $3000, and $2960, which is a key Fibonacci level. On the upside, resistance remains strong at $3190 and $3350. The daily RSI continues to weaken, reflecting the diminishing bullish momentum. A dip below the midline would confirm a bearish reversal, potentially sending Ethereum below the $3000 mark.
ETH/BTC is encountering significant resistance while battling to maintain support at the 100-day MA. After a period of decline following the breakdown of the symmetrical triangle earlier in August, Ethereum against Bitcoin has found temporary relief at the 100-day MA. However, ETH/BTC failed to break above 0.067 BTC in recent days, and the pair has now tested the 100-day MA again for support.
The 100-day moving average is bolstered by the .5 Fibonacci level, making it a critical support zone for Ethereum against Bitcoin. A close above this level today would be crucial for Ethereum to maintain bullish prospects.
Looking ahead, immediate support for ETH/BTC lies at 0.065 BTC, coinciding with both the 100-day MA and the .5 Fibonacci level. If this level fails to hold, further support is found at 0.0645 BTC, 0.0632 BTC, and 0.062 BTC. Resistance levels are located at 0.067 BTC, 0.068 BTC, and the 0.07 BTC zone. A break above these resistance levels could lead to a shift in momentum back toward the 0.072 BTC level.