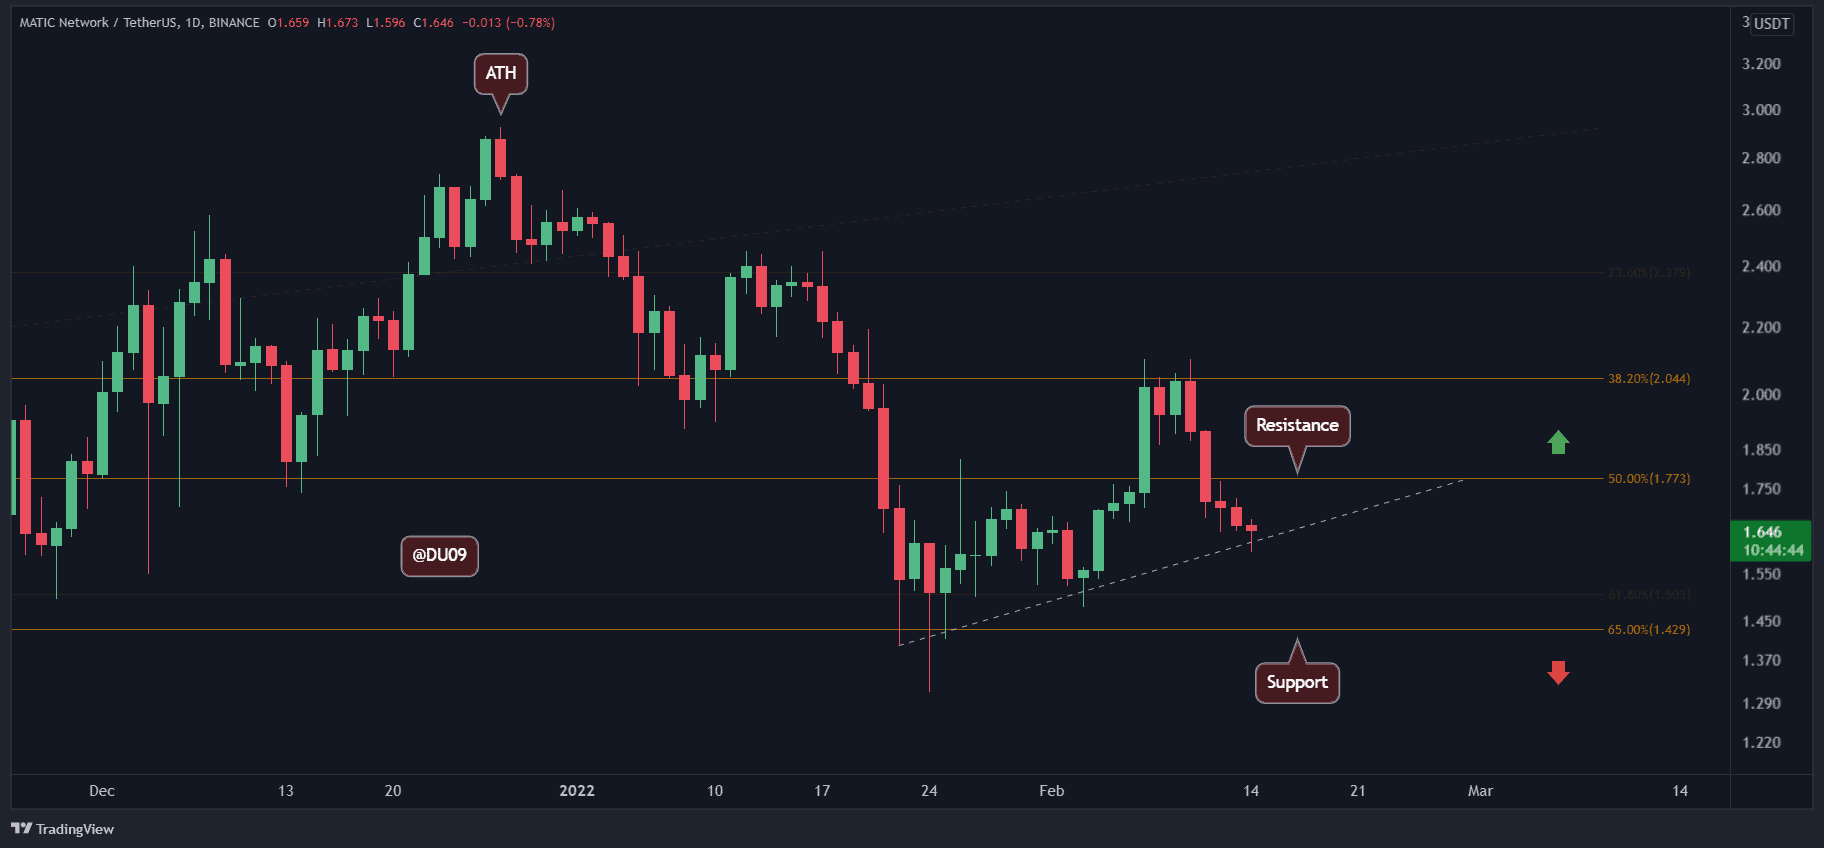
MATIC encountered a sharp decline after reaching the $2 resistance, causing its price to fall to around $1.6. Should this downward trend persist, the next major support is anticipated at $1.4, while the immediate resistance now resides at $1.8.
In the past five days, there has been a notable reduction in trading volume, reflecting a significant pullback following MATIC’s inability to surpass the $2 resistance. Presently, buying interest seems minimal, with many market participants possibly holding off for a more favorable entry point at lower price levels.
The daily Relative Strength Index (RSI) mirrors the price drop. The critical factor at this stage is whether MATIC can halt its decline at this current level or if it will continue to trend towards the $1.4 support. One important point to observe is whether the RSI avoids forming a lower low.
Additionally, the daily Moving Average Convergence Divergence (MACD) is edging toward a bearish crossover, which may indicate that selling momentum could escalate. In this scenario, it is essential for buyers to protect the $1.6 support to prevent further downward movement.
The overall market sentiment for MATIC remains negative, primarily due to the absence of significant buying interest. This lack of enthusiasm could lead to increased downward pressure.
Unless there is a noticeable increase in buying activity, MATIC is likely to retest the $1.4 support level. Given the prevailing bearish sentiment and technical indicators suggesting limited chances for a reversal in the immediate future, the short-term outlook for MATIC remains unclear.