Ethereum’s price has surged past the $2,000 mark once again, fueling optimism among investors. However, despite growing excitement around the possibility of a new bull market, caution is warranted due to potential short-term corrections that could follow such sharp movements.
The Daily Chart
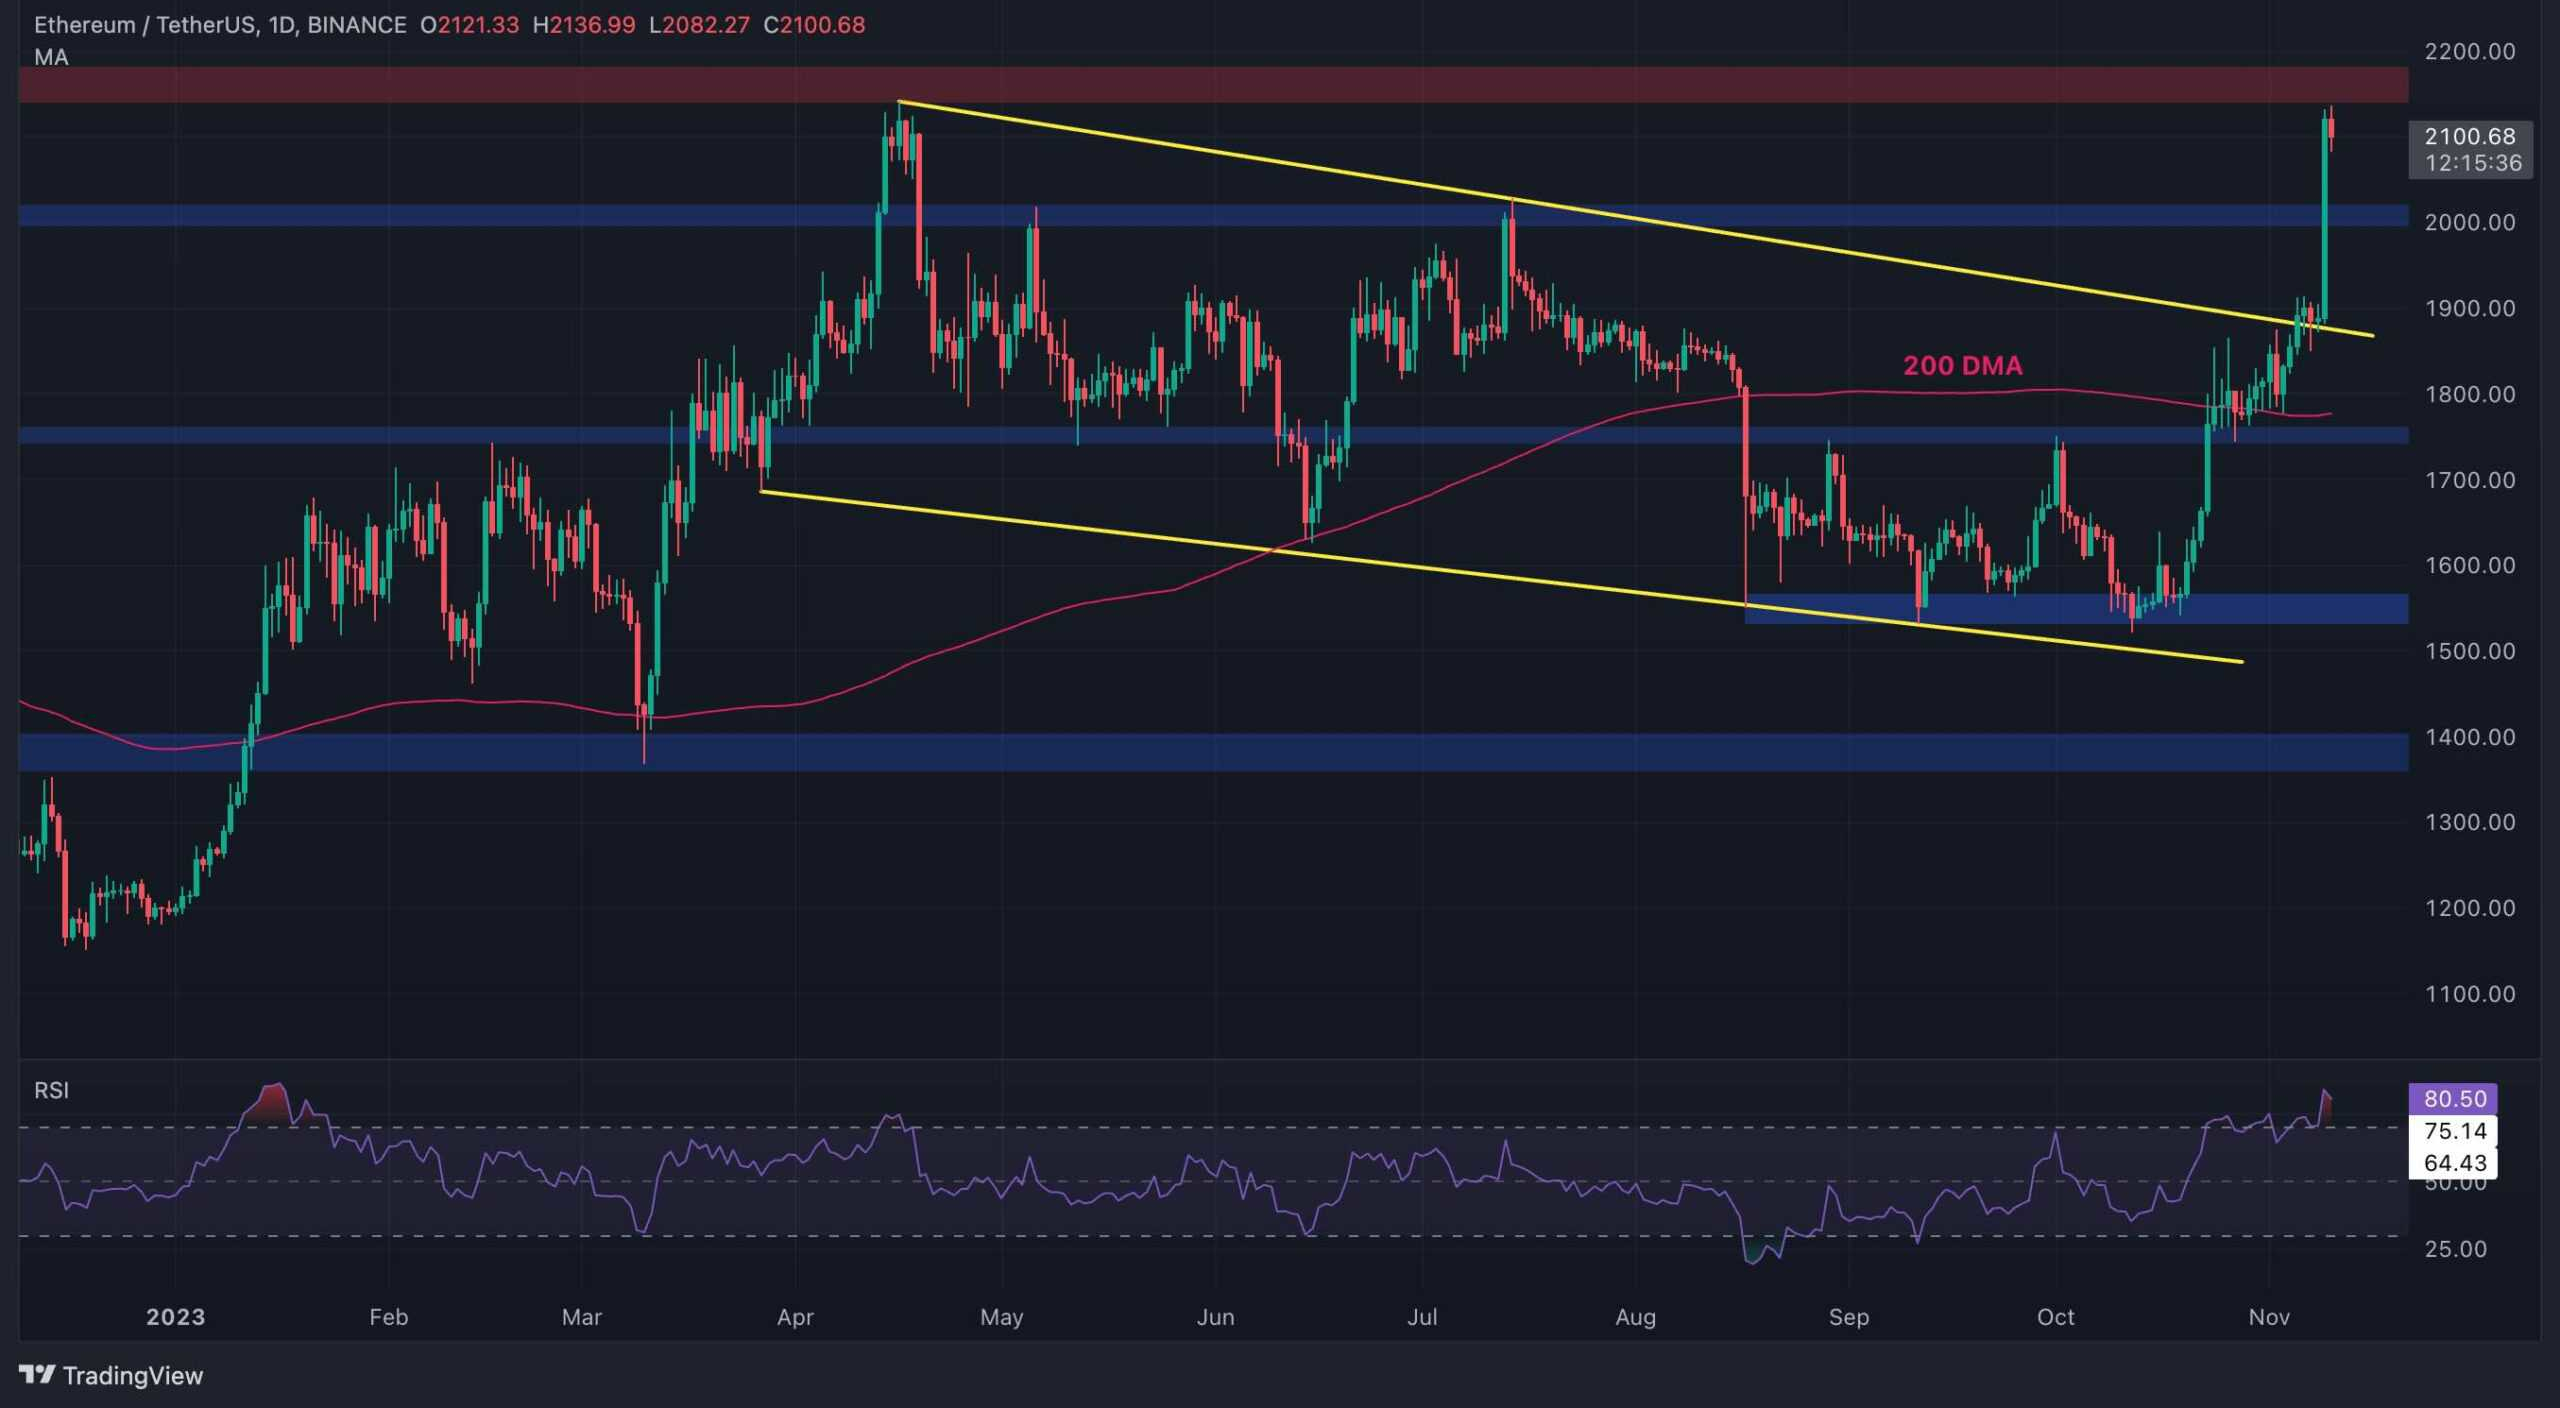
On the daily timeframe, Ethereum has experienced a significant rally after being supported by the 200-day moving average near the $1,800 level. The breakout from a large descending channel was a clear bullish signal, suggesting that the market could be entering a new bullish phase. However, after such a strong move, a correction or consolidation is likely in the short term.
The price has now reached the $2,200 resistance zone, with the Relative Strength Index (RSI) entering overbought territory. This overbought condition, combined with the proximity to resistance, suggests that Ethereum may face a pullback in the near future. The $2,000 level, which previously acted as resistance, is now expected to provide strong support. If Ethereum fails to hold above this level, the price could retrace further toward the upper trendline of the broken descending channel, potentially reaching $1,950.
The 4-Hour Chart
On the 4-hour chart, Ethereum’s price movement indicates a clear bullish continuation pattern. After bouncing from the $1,550 level in October, Ethereum spent several weeks accumulating below the $2,000 level, establishing a clear price range. The breakout yesterday resulted from this prolonged accumulation phase. Now, Ethereum is testing the $2,150 resistance zone.
Similar to the daily chart, the RSI on the 4-hour chart is signaling an overbought condition, which suggests that Ethereum is at risk of a short-term pullback. The next critical support levels are expected around $2,000, followed by $1,950 if the price fails to maintain its upward trajectory. A consolidation phase within this range is possible before Ethereum can attempt another breakout to higher levels.
Funding Rates
Ethereum’s recent surge has been significant, with prices breaking above the $2,000 mark. However, the funding rates in the derivatives market indicate an increase in trader optimism, which can be both a positive and a negative signal. While positive funding rates are typically seen in bullish markets, excessively high funding rates can indicate that the market is becoming overheated and could face a correction.
The funding rates have surged to levels last seen during the end of the 2021 bull market, which could be a warning sign for potential long liquidation cascades if the price fails to maintain upward momentum. As such, market participants should be cautious of potential volatility and look for signs of a potential short-term correction.
Conclusion and Prediction
Ethereum’s strong price action is indicative of a potential long-term bull market; however, in the short term, the market may face a consolidation or pullback phase. The immediate support level lies at $2,000, followed by $1,950. If the price fails to hold above these levels, Ethereum could face deeper retracements toward the $1,850 range. On the upside, a sustained break above $2,200 could lead to further bullish momentum, but traders should remain cautious of potential volatility.
Ethereum is likely to experience short-term fluctuations, with a focus on maintaining support around the $2,000 level. The market’s reaction to this support zone will be critical in determining the next phase of Ethereum’s price action.


