Bitcoin’s price is currently consolidating just below the highly anticipated $100K mark, with investors anxiously awaiting the breakthrough. Despite recent price drops, the possibility of reaching a six-figure Bitcoin price still remains in focus.
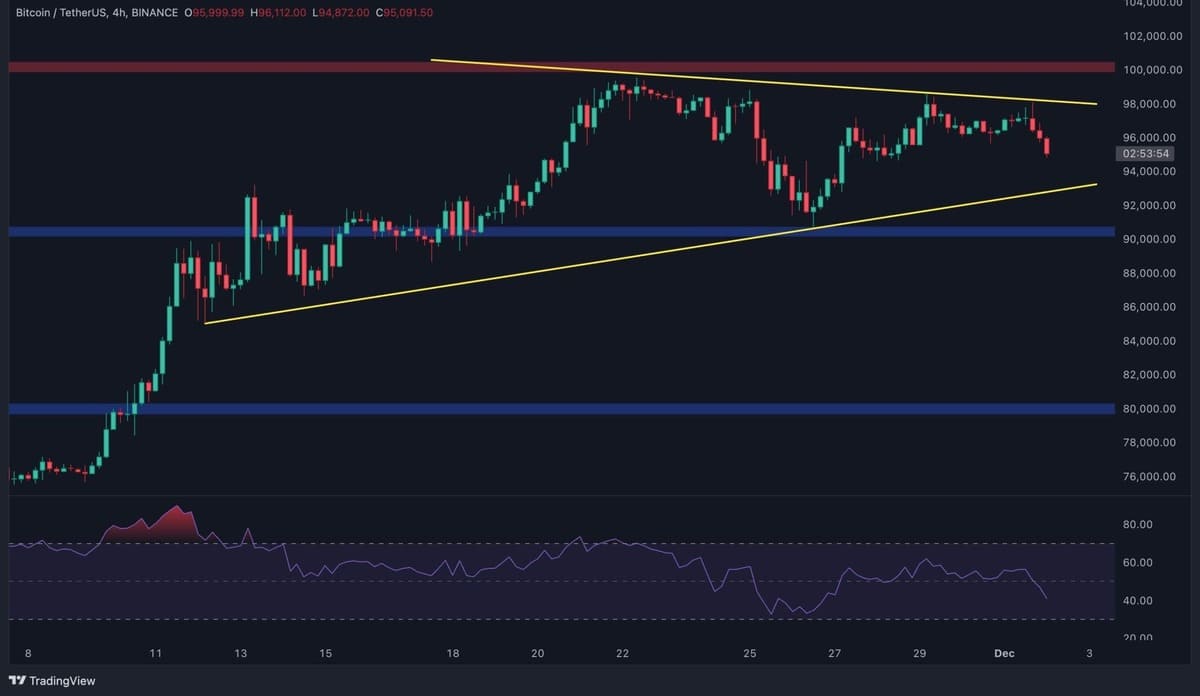
Bitcoin has successfully broken through several resistance levels in recent weeks, making steady progress toward the $100K level. However, the price has yet to breach this milestone, with the market currently in a sideways motion. The $90K support level remains intact, offering hope for a bullish breakout. If Bitcoin can hold above this level, the next significant resistance at $100K might be tested soon.
On the other hand, if the $90K support level fails to hold, Bitcoin could experience a sharp pullback toward the $80K region, testing lower support levels.
The 4-hour chart shows that Bitcoin is currently consolidating within a symmetrical triangle pattern. Symmetrical triangles can act as both continuation and reversal patterns, depending on the direction of the breakout. If Bitcoin breaks above the upper boundary of the triangle, the likelihood of a bullish continuation toward the $100K milestone would increase, with potential for further upside.
The exchange netflow metric provides valuable insight into the distribution and accumulation of Bitcoin in the spot market. Positive netflows indicate distribution, while negative netflows point to accumulation.
As per recent data, there have been significant negative netflows, signaling that investors are actively accumulating Bitcoin in anticipation of a price rally above $100K. The 30-day moving average for Bitcoin netflows has consistently shown negative values for the past six months, confirming the strong accumulation trend. If the derivatives market does not pose a significant obstacle, the demand in the spot market may eventually push Bitcoin’s price higher in the coming months, bringing it closer to the $100K target.


