Bitcoin has struggled to produce any significant daily price movement in recent months, with the market currently experiencing a prolonged range phase and extremely low volatility. However, technical indicators suggest that Bitcoin may be on the cusp of a major move.
Technical Analysis: Key Resistance and Support Levels
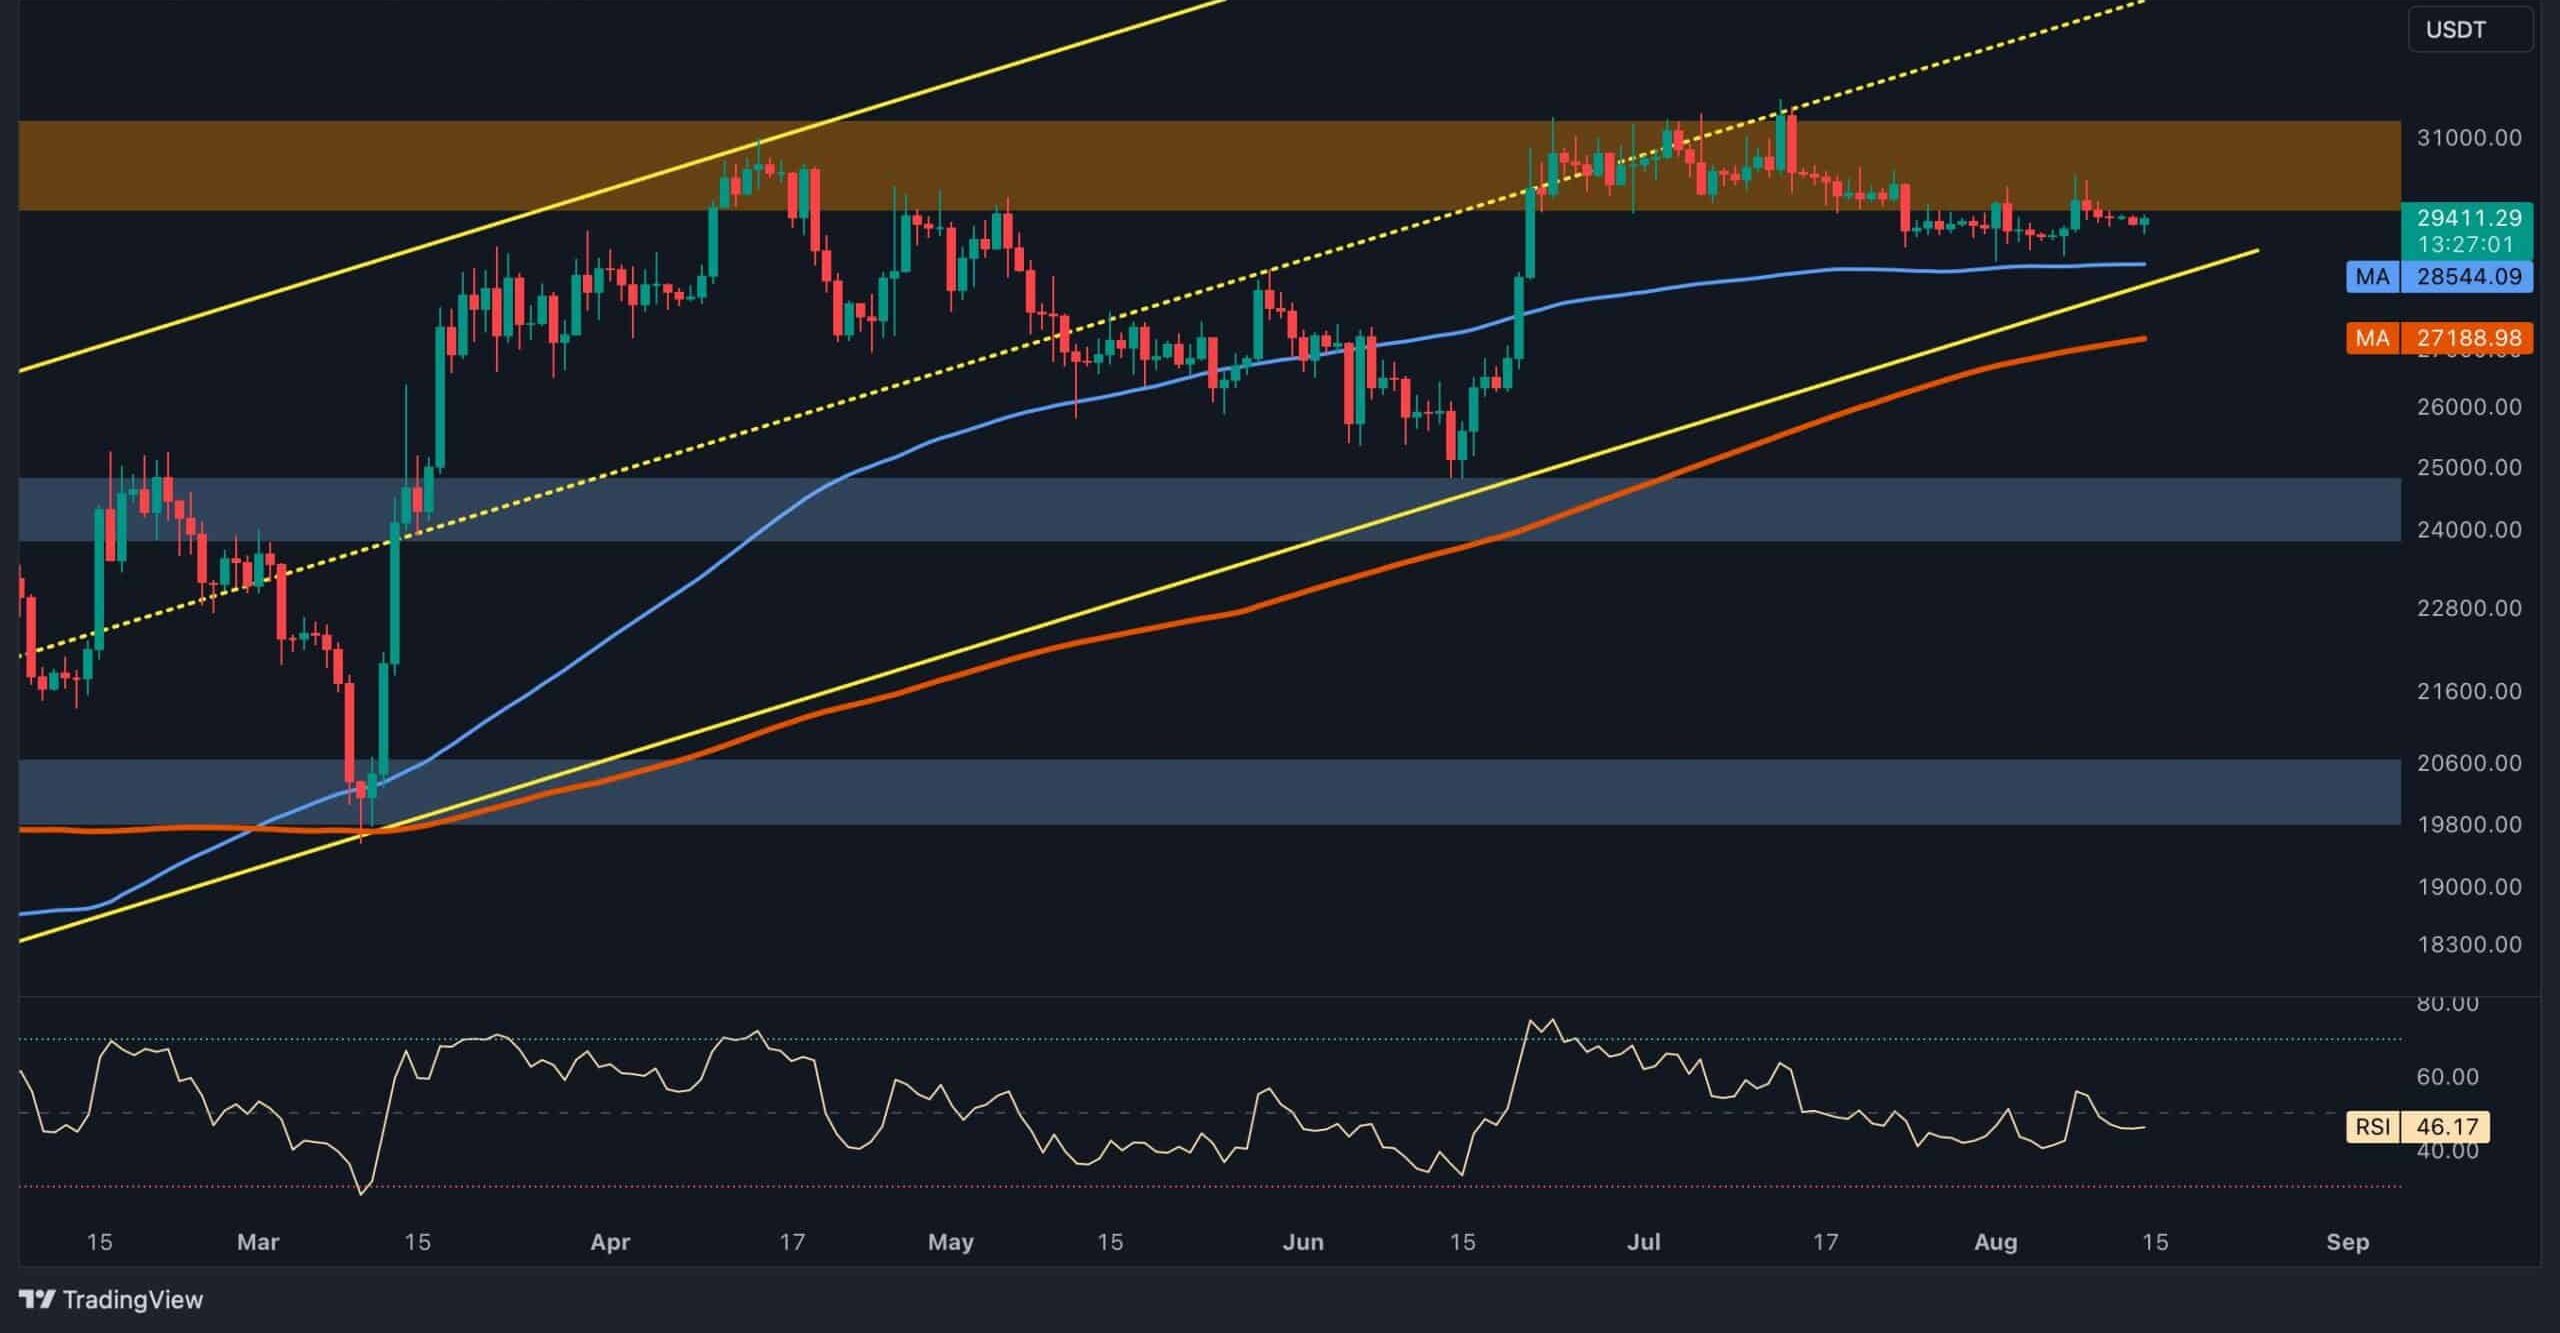
The daily chart shows that Bitcoin has formed a triangle pattern, signaling that volatility could soon return. Currently, the price is facing two crucial resistance levels: the 50-day moving average and the upper boundary of the triangle, both aligning near the $19.5K level. In order for Bitcoin to regain investor confidence and shift the trend towards a bullish move, it will need to break through these resistances. A successful breakout could lead to a rise toward the $25K level, a significant resistance zone. On the flip side, if Bitcoin fails to break above $19.5K, the price could face a rejection, sending it back to test the $16K support region.
4-Hour Chart: Range-bound Market Continues
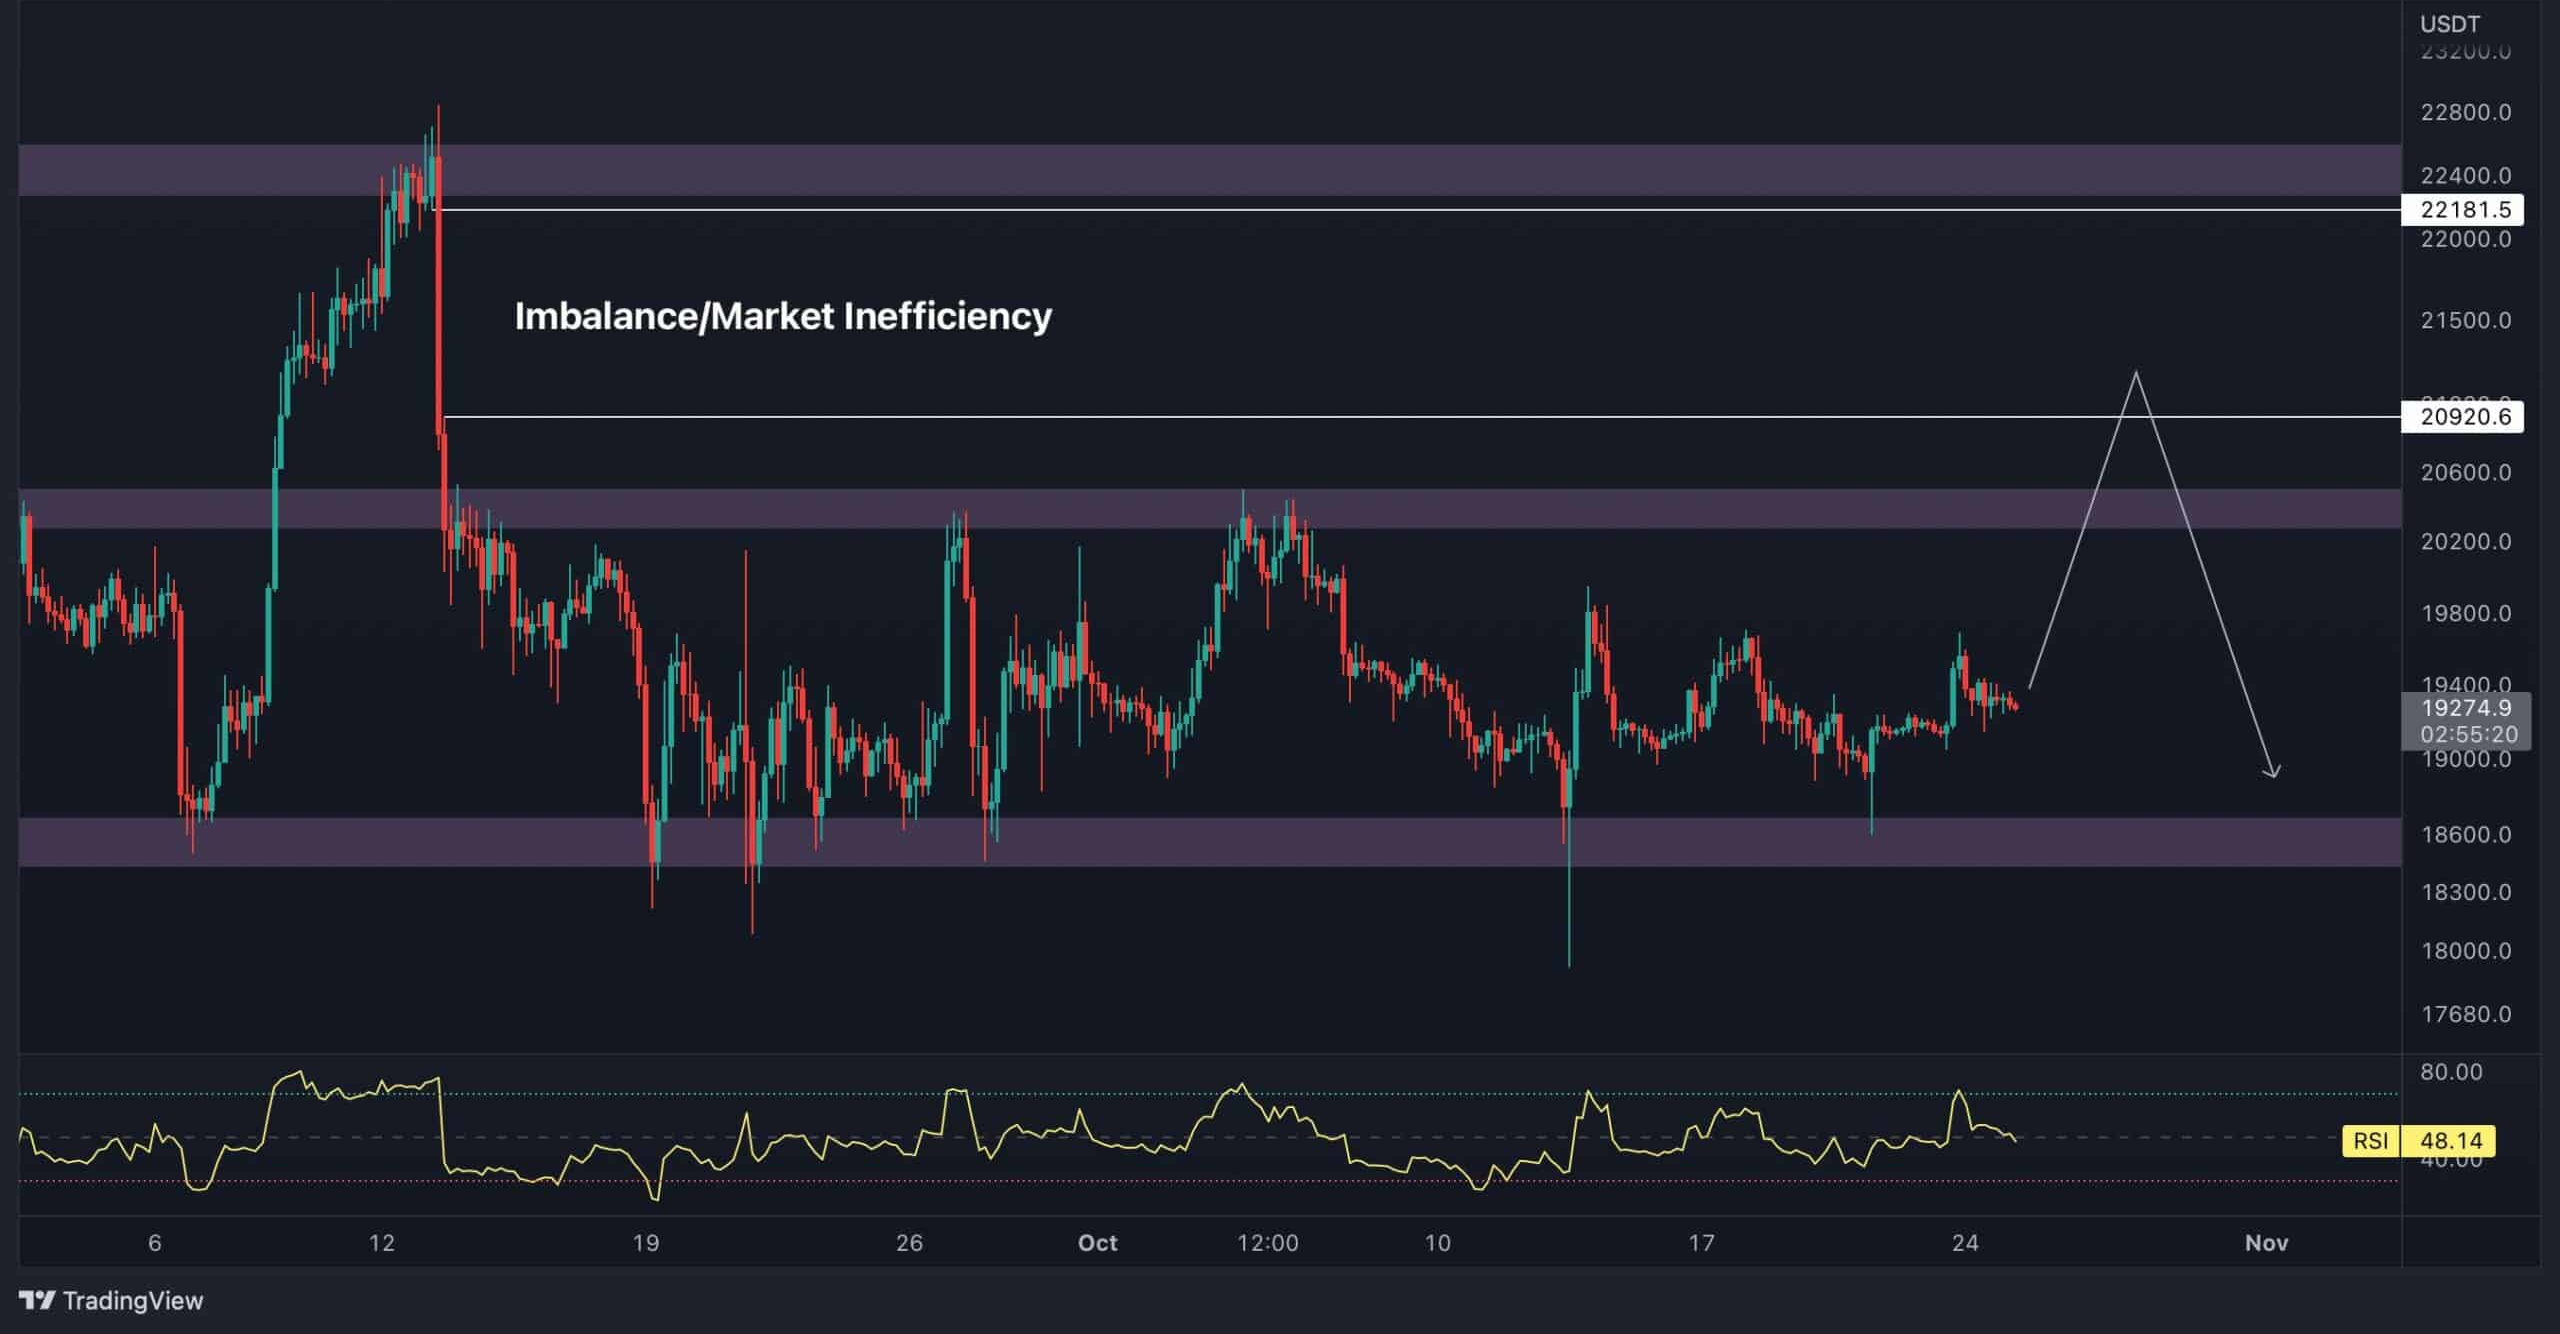
On the 4-hour chart, Bitcoin has been stuck in a tight range between $18K and $25K since mid-June. The $20.5K level has acted as a strong resistance, repeatedly rejecting price attempts to break higher. However, there is a noticeable inefficiency in the market between the $20.9K and $22K levels, which is likely to fuel a significant price movement once addressed. The most probable scenario in the short term is for Bitcoin to explore this imbalance, which could lead to another bearish move toward the $18K support. If this support level fails, the $16K level will become a more likely target.
Onchain Analysis: Bearish Sentiment Persists
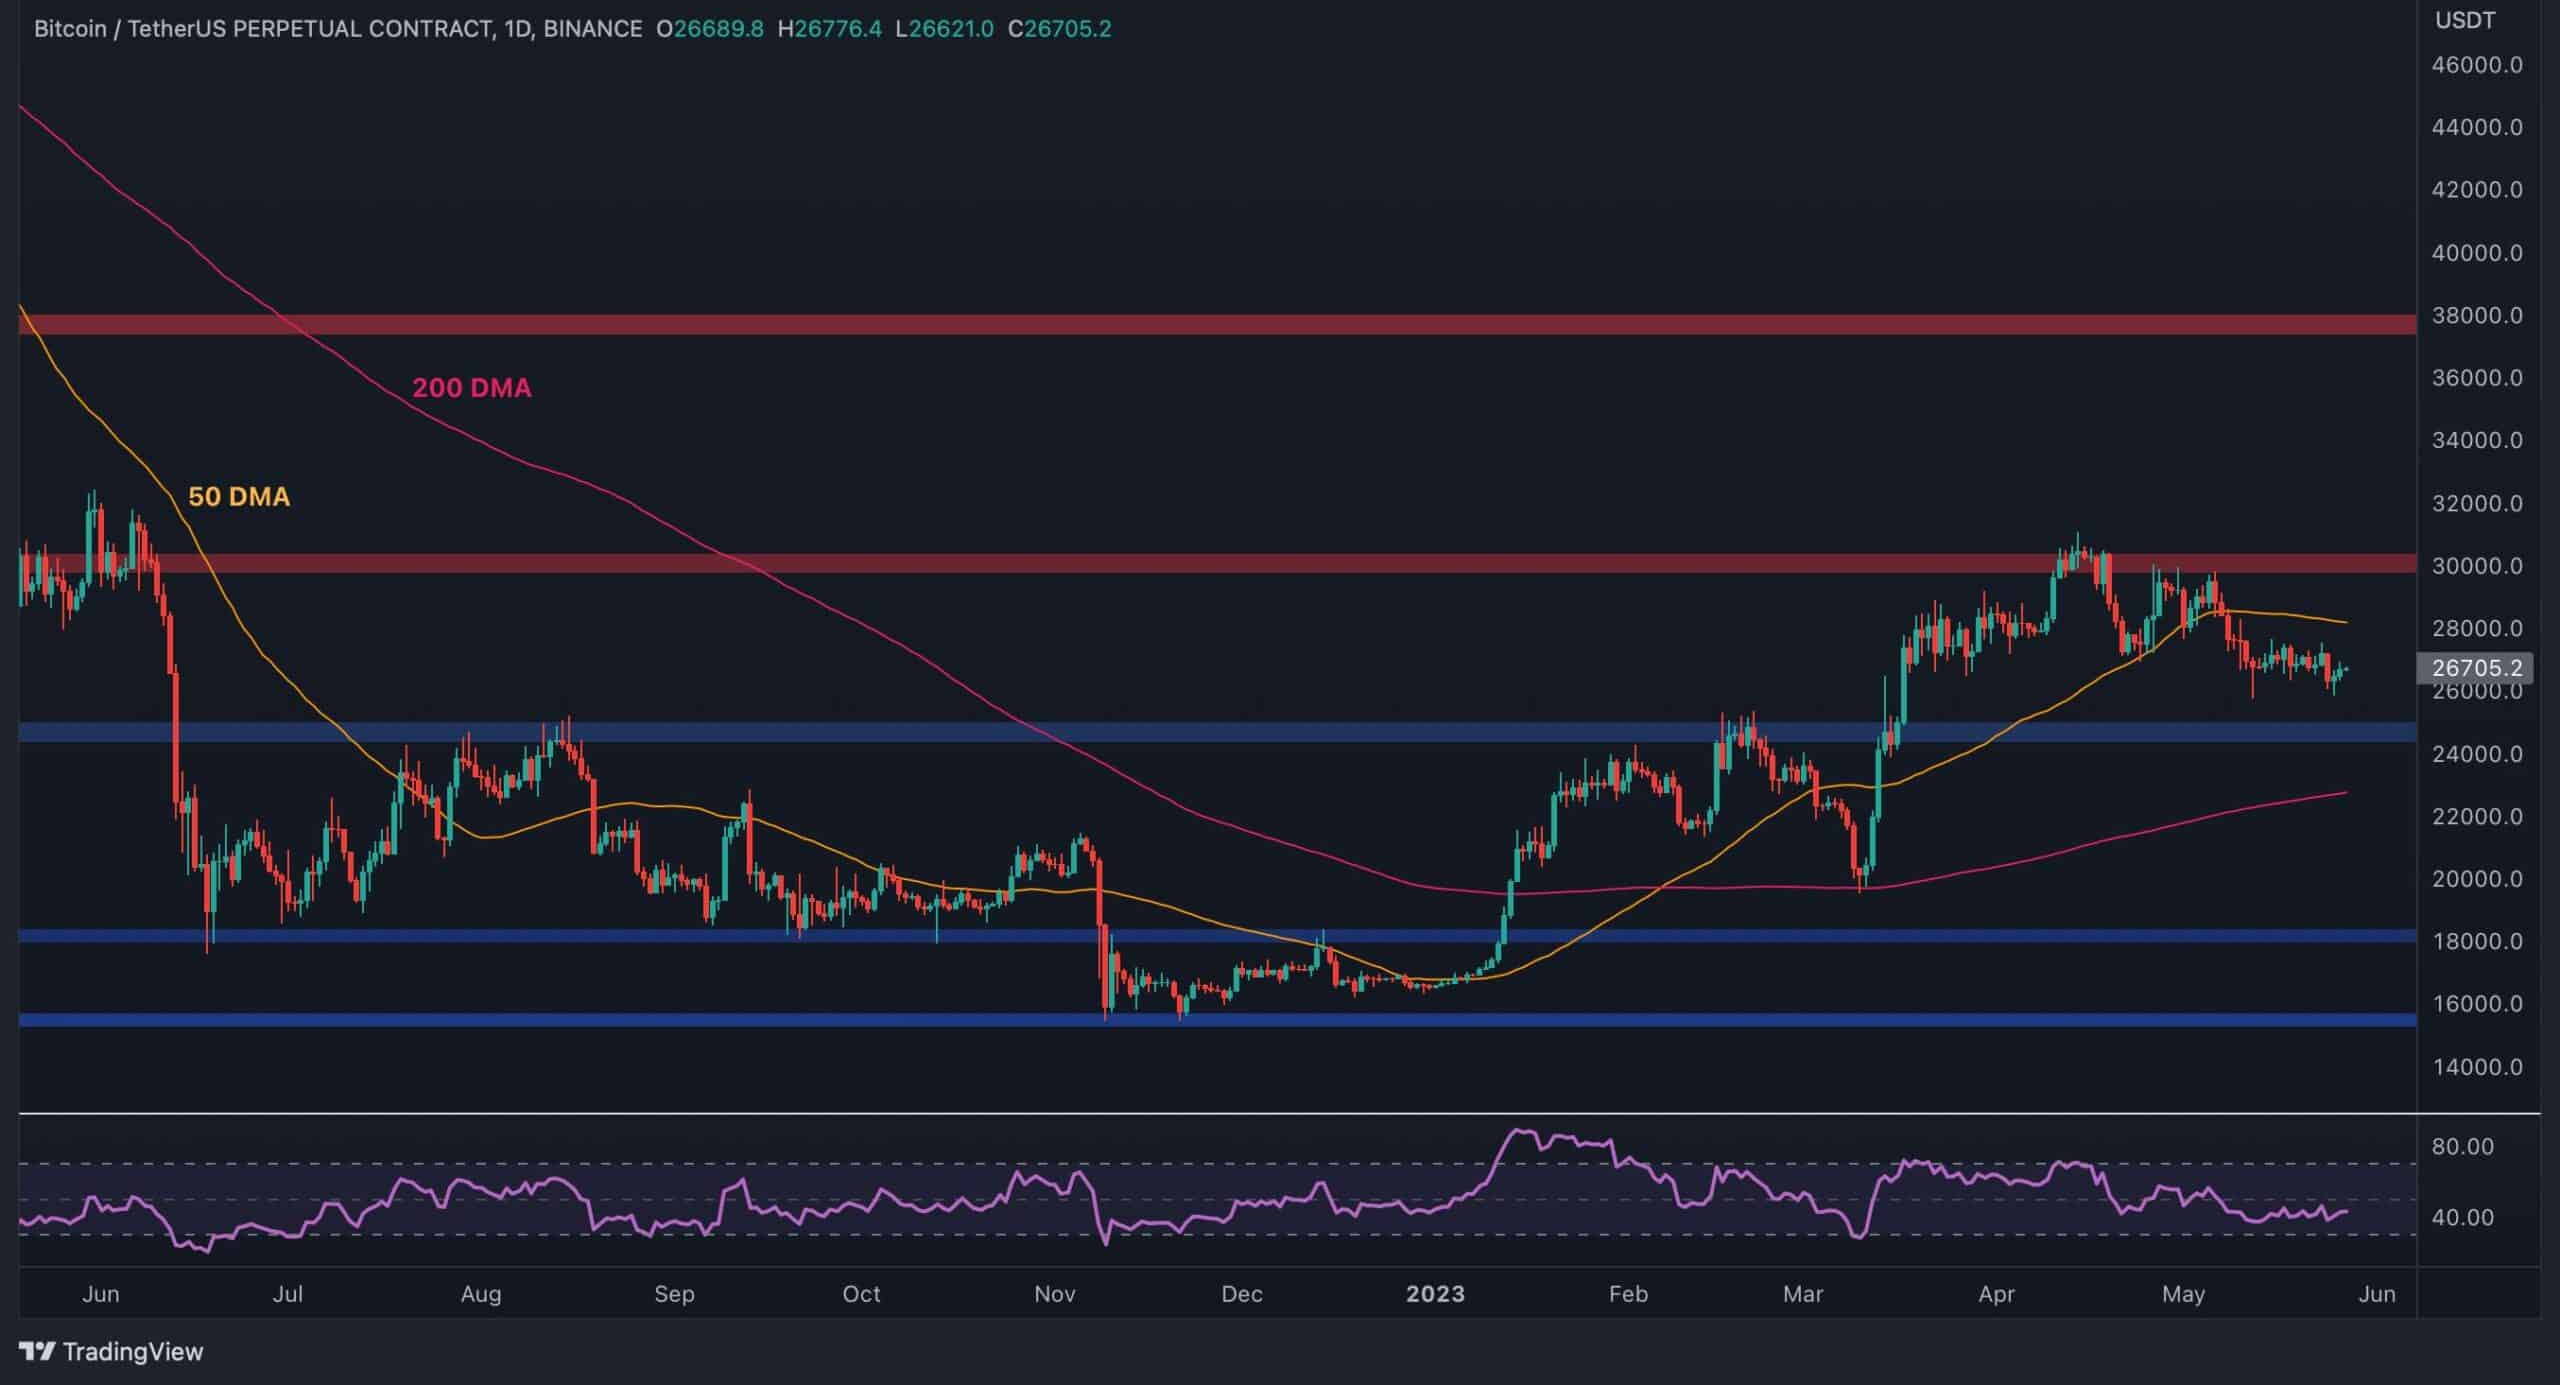
Despite Bitcoin’s attempts to form a reversal from the $18K support region, it has failed to gain significant momentum and remains trapped within the $18K-$24K price channel. Onchain data provides further insight into the market’s sentiment, particularly the Short-Term Holder SOPR (Spent Output Profit Ratio) metric. This indicator shows whether short-term holders are selling at a loss. Compared to the 2018 and 2015 bear markets, the SOPR has not dropped substantially, suggesting that many short-term holders have not yet realized significant losses. This indicates that there is still room for further downside, as the market may need to experience more capitulation before a genuine reversal can occur.
While Bitcoin’s price has been consolidating for several months, critical resistance levels at $19.5K and support at $16K are pivotal for determining the next significant move. A break above $19.5K could signal a bullish phase, while failure to do so could push Bitcoin lower, potentially retesting the $16K support. Moreover, the lack of significant losses among short-term holders implies that further downside remains possible, with a potential capitulation event on the horizon.