XRP has shown signs of recovery after successfully recapturing the 200-day moving average (MA) line on the daily chart. This marks a positive psychological shift in market sentiment following a period of struggle since mid-November. The price action indicates that XRP could be entering a new phase of bullish momentum.
Technical Analysis: Resistance at $0.42-$0.43 Remains Key
Despite the positive sentiment observed on the chart, XRP still faces significant horizontal resistance in the $0.42 to $0.43 range. This level has acted as a major barrier for the asset since the May market collapse. If XRP manages to overcome this resistance, an upward trend targeting $0.55 seems likely. This level has proven to be a strong resistance point in both September and October, so a successful breakthrough could lead to further gains.
On the other hand, a brief pullback to the $0.37 level would be considered a healthy correction, allowing the market to reset before another attempt at overcoming the $0.42-$0.43 resistance. As long as XRP maintains trading above this level, it could continue to test the key overhead resistance.
Moving Averages: Indicating Potential for Further Upside
XRP’s moving averages further highlight the potential for upside movement. The MA20 is at $0.38, the MA50 is at $0.44, and the MA100 is at $0.41, all of which are aligned to support the current price action. However, the MA50 at $0.44 remains a key resistance level to watch for any signs of a more significant move to the upside.
The XRP/BTC Chart: Positive Signs Emerging Against Bitcoin
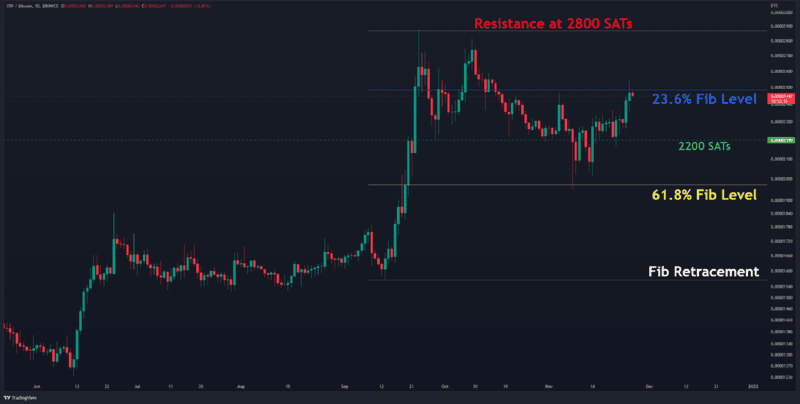
Against Bitcoin, XRP is showing early signs of a reversal in its negative trend. In the most recent correction, no candle closed below the 2000 SATs level, emphasizing the significance of this level as critical support. The pair has already recovered from the 61.8% Fibonacci level and is currently testing the 23.6% level at 2500 SATs. If XRP can break above this resistance, it could potentially target a retest of the 2800 SATs level.
The primary support for XRP/BTC is found at 2200 SATs. The short-term outlook remains positive as long as the price stays above this level, and any moves above the 2500 SATs resistance would further bolster the bullish narrative.
A Critical Moment for XRP’s Price Action
XRP is showing signs of positive momentum, with the 200-day moving average offering crucial support. However, the asset must overcome key resistance in the $0.42-$0.43 range to target higher levels. If this resistance is broken, the path to $0.55 appears likely. Monitoring the pullback to $0.37 will also be essential to ensure that the trend remains intact. In the short term, the outlook remains optimistic, especially if XRP can maintain its position above critical support levels against both USD and BTC.


